为什么回表性能这么差

为提高效率,请提供以下信息,问题描述清晰能够更快得到解决:
【 TiDB 使用环境】
公司线上业务

【概述】 场景 + 问题概述
通过uid+type查询,使用time倒序排列,uid+type+time建立了索引,还有几个字段read和content等没做索引。表数据量10亿+
select索引外的数据查询耗时飙升

【背景】 做过哪些操作
条件字段均已索引

【现象】 业务和数据库现象
查询耗时飙升

【问题】 当前遇到的问题
如果select 索引内的任意一个字段,响应时间在0.6s左右,加上索引外的任意一个,查询耗时飙升到2-5s左右,反复执行,耗时都在2s以上。explain 有TableRowIDScan 操作,证明有回表
如果仅select 主键id,大概耗时0.6s,再根据主键id select *大概耗时0.015s,累计0.615s,远小于2-5s
为什么分开查询和回表性能差距这么大,我理解应该是一致的才对。

【业务影响】
大量慢查询

【TiDB 版本】
4.0.14

【应用软件及版本】
php 7.4

【附件】 相关日志及配置信息

  • TiUP Cluster Display 信息
  • TiUP CLuster Edit config 信息

监控(https://metricstool.pingcap.com/)

  • TiDB-Overview Grafana监控
  • TiDB Grafana 监控
  • TiKV Grafana 监控
  • PD Grafana 监控
  • 对应模块日志(包含问题前后 1 小时日志)

若提问为性能优化、故障排查类问题,请下载脚本运行。终端输出的打印结果,请务必全选并复制粘贴上传。

explain analyze 执行计划和表结构贴下

1 个赞

表结构

CREATE TABLE `viewpoints_information_v2` (
  `uuid` bigint(20) NOT NULL /*T![auto_rand] AUTO_RANDOM(5) */,
  `id` bigint(20) NOT NULL,
  `uid` bigint(20) NOT NULL,
  `is_read` tinyint(1) NOT NULL DEFAULT '0',
  `type` tinyint(1) NOT NULL DEFAULT '0',
  `event_time` int(11) NOT NULL,
  `contents` text COLLATE utf8mb4_unicode_ci NOT NULL,
  PRIMARY KEY (`uuid`),
  KEY `id` (`id`),
  KEY `list` (`uid`,`type`,`event_time`),
  KEY `uid` (`uid`),
  KEY `type` (`type`),
  KEY `event_time` (`event_time`),
  KEY `update_is_read` (`uid`,`id`,`type`,`is_read`)
) ENGINE=InnoDB DEFAULT CHARSET=utf8mb4 COLLATE=utf8mb4_unicode_ci /*T![auto_rand_base] AUTO_RANDOM_BASE=1197293097 */;
1 个赞

这是获取任意一个索引外的字段


screenshot-20210917-105505

±-----------------------------------±--------±--------±----------±-------------------------------------------------------------------±------------------------------------------------------------------------------------------------------------------------------------------------------------------------------------------------------------------------------------------------------------------------------------------------------------------------------------------------------------------------------------------------±-------------------------------------------------------------------------±--------±-----+
| id | estRows | actRows | task | access object | execution info | operator info | memory | disk |
±-----------------------------------±--------±--------±----------±-------------------------------------------------------------------±------------------------------------------------------------------------------------------------------------------------------------------------------------------------------------------------------------------------------------------------------------------------------------------------------------------------------------------------------------------------------------------------±-------------------------------------------------------------------------±--------±-----+
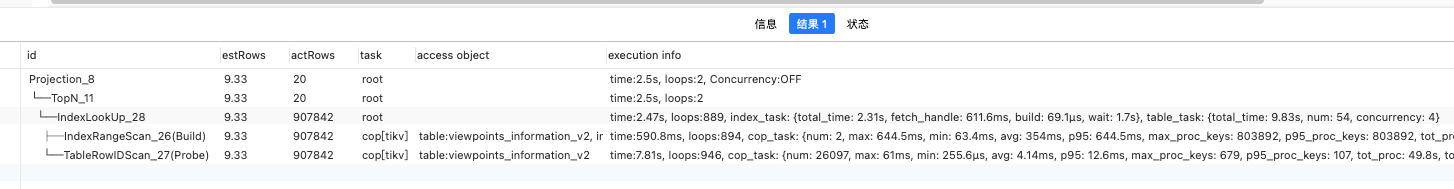
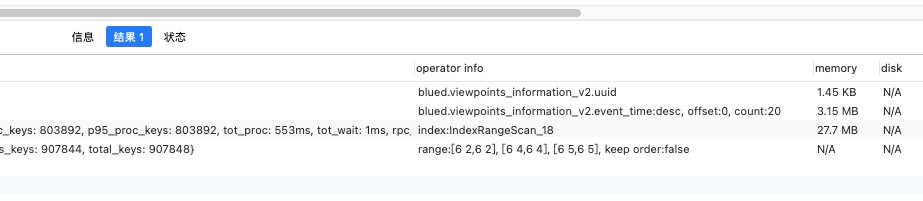
| Projection_8 | 9.33 | 20 | root | | time:4.92s, loops:2, Concurrency:OFF | blued.viewpoints_information_v2.uuid, blued.viewpoints_information_v2.id | 1.82 KB | N/A |
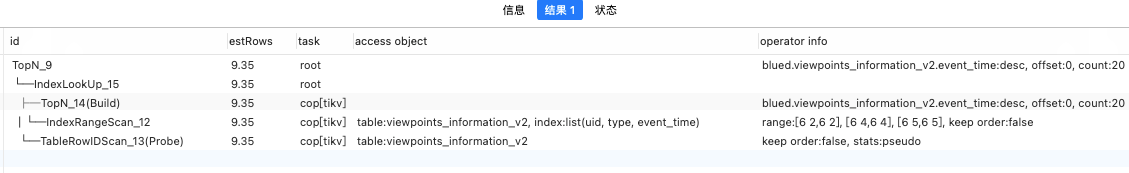
| └─TopN_11 | 9.33 | 20 | root | | time:4.92s, loops:2 | blued.viewpoints_information_v2.event_time:desc, offset:0, count:20 | 95.6 KB | N/A |
| └─IndexLookUp_28 | 9.33 | 907853 | root | | time:4.89s, loops:889, index_task: {total_time: 4.5s, fetch_handle: 919.1ms, build: 68.8µs, wait: 3.58s}, table_task: {total_time: 19.4s, num: 54, concurrency: 4} | | 18.1 MB | N/A |
| ├─IndexRangeScan_26(Build) | 9.33 | 907853 | cop[tikv] | table:viewpoints_information_v2, index:list(uid, type, event_time) | time:883.6ms, loops:894, cop_task: {num: 2, max: 1.06s, min: 57.8ms, avg: 556.8ms, p95: 1.06s, max_proc_keys: 803892, p95_proc_keys: 803892, tot_proc: 1.08s, rpc_num: 2, rpc_time: 1.11s, copr_cache_hit_ratio: 0.00}, tikv_task:{proc max:428ms, min:50ms, p80:428ms, p95:428ms, iters:896, tasks:2}, scan_detail: {total_process_keys: 907853, total_keys: 907857} | range:[6 2,6 2], [6 4,6 4], [6 5,6 5], keep order:false | N/A | N/A |
| └─TableRowIDScan_27(Probe) | 9.33 | 907853 | cop[tikv] | table:viewpoints_information_v2 | time:17.5s, loops:946, cop_task: {num: 26097, max: 143.1ms, min: 334.6µs, avg: 9.49ms, p95: 26.2ms, max_proc_keys: 679, p95_proc_keys: 125, tot_proc: 2m20.1s, tot_wait: 1m29.3s, rpc_num: 26097, rpc_time: 4m7.3s, copr_cache_hit_ratio: 0.00}, tikv_task:{proc max:68ms, min:0s, p80:7ms, p95:14ms, iters:37674, tasks:26097}, scan_detail: {total_process_keys: 901162, total_keys: 926136} | keep order:false | N/A | N/A |
±-----------------------------------±--------±--------±----------±-------------------------------------------------------------------±------------------------------------------------------------------------------------------------------------------------------------------------------------------------------------------------------------------------------------------------------------------------------------------------------------------------------------------------------------------------------------------------±-------------------------------------------------------------------------±--------±-----+
5 rows in set (4.95 sec)

1 个赞

这是只取索引内的字段的

使用主键单独获取的只有Batch_Point_Get_1,就不贴了

mysql> EXPLAIN ANALYZE SELECT uuid FROM viewpoints_information_v2 WHERE uid=6 AND type IN (2,4,5) ORDER BY event_time DESC LIMIT 0,20;
±----------------------------±--------±--------±----------±-------------------------------------------------------------------±---------------------------------------------------------------------------------------------------------------------------------------------------------------------------------------------------------------------------±--------------------------------------------------------------------±--------±-----+
| id | estRows | actRows | task | access object | execution info | operator info | memory | disk |
±----------------------------±--------±--------±----------±-------------------------------------------------------------------±---------------------------------------------------------------------------------------------------------------------------------------------------------------------------------------------------------------------------±--------------------------------------------------------------------±--------±-----+
| Projection_8 | 9.33 | 20 | root | | time:568.7ms, loops:2, Concurrency:OFF | blued.viewpoints_information_v2.uuid | 1.45 KB | N/A |
| └─TopN_11 | 9.33 | 20 | root | | time:568.7ms, loops:2 | blued.viewpoints_information_v2.event_time:desc, offset:0, count:20 | 3.15 MB | N/A |
| └─IndexReader_19 | 9.33 | 907856 | root | | time:506.2ms, loops:890, cop_task: {num: 2, max: 546ms, min: 290.4µs, avg: 273.1ms, p95: 546ms, max_proc_keys: 803892, p95_proc_keys: 803892, tot_proc: 434ms, rpc_num: 2, rpc_time: 546.3ms, copr_cache_hit_ratio: 0.50} | index:IndexRangeScan_18 | 27.7 MB | N/A |
| └─IndexRangeScan_18 | 9.33 | 907856 | cop[tikv] | table:viewpoints_information_v2, index:list(uid, type, event_time) | tikv_task:{proc max:364ms, min:47ms, p80:364ms, p95:364ms, iters:896, tasks:2}, scan_detail: {total_process_keys: 803892, total_keys: 803894} | range:[6 2,6 2], [6 4,6 4], [6 5,6 5], keep order:false | N/A | N/A |
±----------------------------±--------±--------±----------±-------------------------------------------------------------------±---------------------------------------------------------------------------------------------------------------------------------------------------------------------------------------------------------------------------±--------------------------------------------------------------------±--------±-----+
4 rows in set (0.70 sec)

1 个赞

我又测试了一下,如果去掉order by,性能也不错,虽然也回表了,不知道是不是查询缓存
但是一旦带上order by,再回表,耗时就很多了

1 个赞

sql 都贴下

1 个赞

现在的业务查询
SELECT id,uid,is_read,type,event_time,contents FROM viewpoints_information_v2 FORCE INDEX (list) WHERE uid=6 AND type IN (2,4,5) ORDER BY event_time DESC LIMIT 0,20

只查主键
SELECT uid FROM viewpoints_information_v2 FORCE INDEX (list) WHERE uid=6 AND type IN (2,4,5) ORDER BY event_time DESC LIMIT 0,20

1 个赞

看下SQL执行时dashboard慢SQL里或information_schema.CLUSTER_SLOW_QUERY 里Rocksdb_block_read_xxx,确认是否有比较多的磁盘读

1 个赞

information_schema里没有找到 Rocksdb_block_read_xxx 这样的字段,这是我随机导出的100条日志
dashboard 临时有问题,没法访问无标题.csv (394.2 KB)

1 个赞

现在情况如何了

1 个赞

还没解决

1 个赞

这个确实不合理,这个 SQL 应该 limit 下推到 tikv 的,执行速度应该很快才对,我需要确认一下

1 个赞

explain SELECT /*+ limit_to_cop() */ id,uid,is_read,type,event_time,contents FROM viewpoints_information_v2 FORCE INDEX (list) WHERE uid=6 AND type IN (2,4,5) ORDER BY event_time DESC LIMIT 0,20; 可以试一下这个 hint,看看效果如何,你这个版本没有 limit 下推,需要高版本才行

1 个赞

执行速度好很多

那就OK,高版本会彻底解决这个问题,limit 下推 v4 没有

好的,这个 limit 下推就是我的问题根源吗

:smile:,不过建议你给我一下,你添加 hint 之后的 执行计划(explain analyze 的,不要 explain 的)