【TiDB 使用环境】测试
【TiDB 版本】v8.5.3
【操作系统】centos7.9
【部署方式】虚拟机 /SSD
【集群数据量】300w
【集群节点数】3个
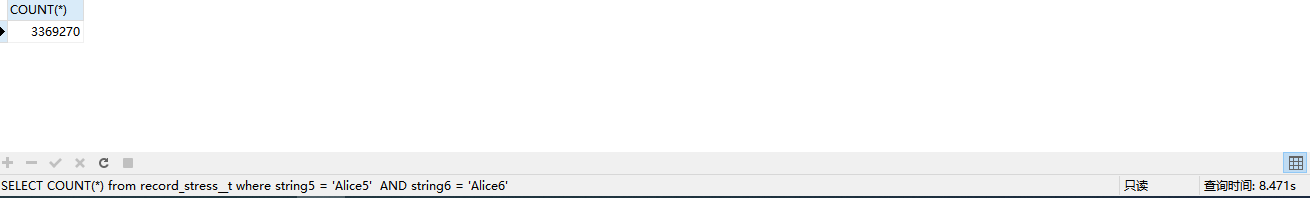
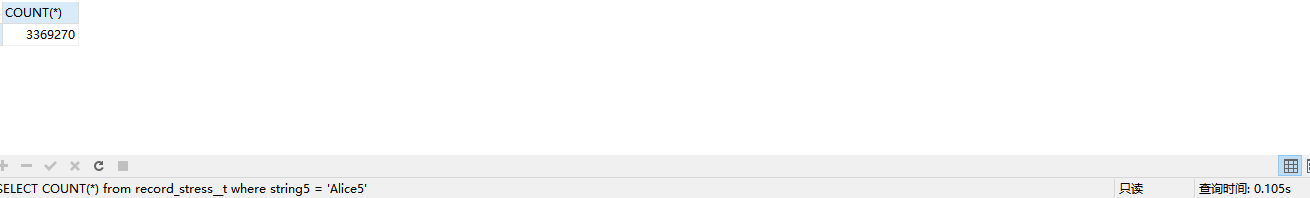
【遇到的问题:问题现象及影响】性能差别几十倍
【资源配置】进入到 TiDB Dashboard -集群信息 (Cluster Info) -主机(Hosts) 截图此页面
【复制黏贴 ERROR 报错的日志】
【其他附件:截图/日志/监控】
SELECT COUNT() from record_stress__t where string5 = ‘Alice5’ AND string6 = ‘Alice6’
SELECT COUNT() from record_stress__t where string5 = ‘Alice5’
SELECT COUNT() from record_stress__t where string5 = ‘Alice5’ AND string6 = ‘Alice6’ 的执行计划
| id | estRows | estCost | actRows | task | access object | execution info | operator info | memory | disk |
| StreamAgg_12 | 1.00 | 1795919.60 | 1 | root | | time:8.25s, loops:2 | funcs:count(1)->Column#48 | 28.7 KB | N/A |
| └─TableReader_24 | 0.29 | 1795905.35 | 3369270 | root | | time:8.19s, loops:3302, cop_task: {num: 59, max: 0s, min: 0s, avg: 0s, p95: 0s, copr_cache_hit_ratio: 0.00} | MppVersion: 2, data:ExchangeSender_23 | 1.87 MB | N/A |
| └─ExchangeSender_23 | 0.29 | 26938469.76 | 3369270 | mpp[tiflash] | | tiflash_task:{time:51.2ms, loops:58, threads:16} | ExchangeType: PassThrough | N/A | N/A |
| └─Selection_22 | 0.29 | 26938469.76 | 3369270 | mpp[tiflash] | | tiflash_task:{time:39.2ms, loops:58, threads:16} | eq(environment_uun000000000001.record_stress__t.string6, “Alice6”) | N/A | N/A |
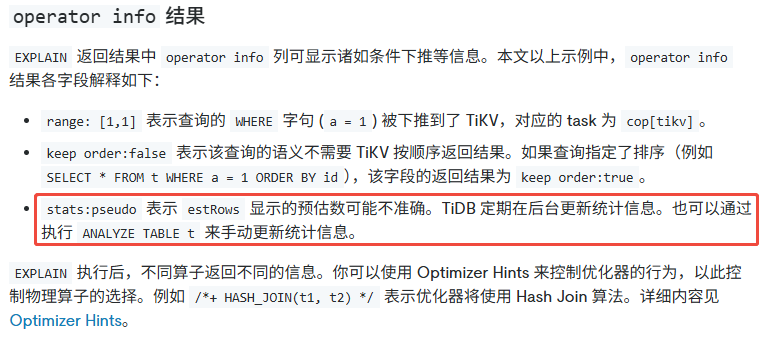
| └─TableFullScan_21 | 285.49 | 25568141.76 | 3369270 | mpp[tiflash] | table:record_stress__t | tiflash_task:{time:38.2ms, loops:58, threads:16}, tiflash_wait: {pipeline_queue_wait: 23ms}, tiflash_scan:{mvcc_input_rows:0, mvcc_input_bytes:0, mvcc_output_rows:0, lm_skip_rows:0, local_regions:15, remote_regions:0, tot_learner_read:3ms, region_balance:{instance_num: 1, max/min: 15/15=1.000000}, delta_rows:0, delta_bytes:0, segments:14, stale_read_regions:0, tot_build_snapshot:0ms, tot_build_bitmap:69ms, tot_build_inputstream:75ms, min_local_stream:13ms, max_local_stream:33ms, dtfile:{data_scanned_rows:3465223, data_skipped_rows:0, mvcc_scanned_rows:395664, mvcc_skipped_rows:552263, lm_filter_scanned_rows:3465223, lm_filter_skipped_rows:0, tot_rs_index_check:13ms, tot_read:242ms}} | pushed down filter:eq(environment_uun000000000001.record_stress__t.string5, “Alice5”), keep order:false, stats:pseudo | N/A | N/A |
单个条件的快的那个执行计划也发一下呢
慢的走了tikv,快的走了tiflash。。两个执行计划都发一下
这两个sql不完全一样啊
SELECT COUNT(*) from record_stress__t where string5 = ‘Alice5’
| HashAgg_27 | 1.00 | root | funcs:count(Column#50)->Column#48 | |
|---|---|---|---|---|
| └─TableReader_29 | 1.00 | root | MppVersion: 2, data:ExchangeSender_28 | |
| └─ExchangeSender_28 | 1.00 | mpp[tiflash] | ExchangeType: PassThrough | |
| └─HashAgg_10 | 1.00 | mpp[tiflash] | funcs:count(1)->Column#50 | |
| └─Selection_26 | 285.49 | mpp[tiflash] | eq(environment_uun000000000001.record_stress__t.string5, Alice5) | |
| └─TableFullScan_25 | 285485.00 | mpp[tiflash] | table:record_stress__t | pushed down filter:empty, keep order:false, stats:pseudo |
dashboard 复制出来的执行计划
| id | estRows | estCost | actRows | task | access object | execution info | operator info | memory | disk |
| HashAgg_27 | 1.00 | 1523263.53 | 1 | root | | time:33.4ms, loops:2, partial_worker:{wall_time:33.411003ms, concurrency:5, task_num:1, tot_wait:33.133688ms, tot_exec:12.067µs, tot_time:165.796221ms, max:33.160518ms, p95:33.160518ms}, final_worker:{wall_time:0s, concurrency:5, task_num:5, tot_wait:2.235µs, tot_exec:101ns, tot_time:165.952635ms, max:33.196709ms, p95:33.196709ms} | funcs:count(Column#50)->Column#48 | 6.48 KB | 0 Bytes |
| └─TableReader_29 | 1.00 | 1521736.27 | 1 | root | | time:33.2ms, loops:2, cop_task: {num: 2, max: 0s, min: 0s, avg: 0s, p95: 0s, copr_cache_hit_ratio: 0.00} | MppVersion: 2, data:ExchangeSender_28 | 791 Bytes | N/A |
| └─ExchangeSender_28 | 1.00 | 22826026.39 | 1 | mpp[tiflash] | | tiflash_task:{time:28.7ms, loops:1, threads:1} | ExchangeType: PassThrough | N/A | N/A |
| └─HashAgg_10 | 1.00 | 22826026.39 | 1 | mpp[tiflash] | | tiflash_task:{time:28.7ms, loops:1, threads:1} | funcs:count(1)->Column#50 | N/A | N/A |
| └─Selection_26 | 285.49 | 22825679.76 | 3369270 | mpp[tiflash] | | tiflash_task:{time:28.7ms, loops:58, threads:16} | eq(environment_uun000000000001.record_stress__t.string5, “Alice5”) | N/A | N/A |
| └─TableFullScan_25 | 285485.00 | 22140515.76 | 3369270 | mpp[tiflash] | table:record_stress__t | tiflash_task:{time:28.7ms, loops:58, threads:16}, tiflash_wait: {pipeline_queue_wait: 5ms}, tiflash_scan:{mvcc_input_rows:0, mvcc_input_bytes:0, mvcc_output_rows:0, lm_skip_rows:0, local_regions:15, remote_regions:0, tot_learner_read:1ms, region_balance:{instance_num: 1, max/min: 15/15=1.000000}, delta_rows:0, delta_bytes:0, segments:14, stale_read_regions:0, tot_build_snapshot:0ms, tot_build_bitmap:38ms, tot_build_inputstream:41ms, min_local_stream:20ms, max_local_stream:25ms, dtfile:{data_scanned_rows:3465223, data_skipped_rows:0, mvcc_scanned_rows:395664, mvcc_skipped_rows:552263, lm_filter_scanned_rows:0, lm_filter_skipped_rows:0, tot_rs_index_check:0ms, tot_read:87ms}} | pushed down filter:empty, keep order:false, stats:pseudo | N/A | N/A |
慢的走的是 streamagg,默认是单线程,要慢于 hashagg。
为什么会有这个差异呢,怎么避免
应该是因为延迟物化功能导致的,多个过滤条件的时候做了谓词下推,导致优化器认为返回行较少,没有做两段聚合+选择 streamagg,导致大量数据返回给 tidb 节点做聚合,就慢了很多。
pushed down filter:eq(environment_uun000000000001.record_stress__t.string5, “Alice5”)
可能得原因
1、统计信息不准确,导致谓词个数不同评估的代价有差异,可以尝试收集一下统计信息,在验证一下。
2、延迟物化实现上的限制
可以session 级别关闭延迟物化看下情况
SET session tidb_opt_enable_late_materialization=off;
1 个赞
没有效果
不一样,慢的那个sql多一个条件
看起来都是走的tiflash
慢的 sql 执行计划再发一下🤔,谓词下推禁止了吗?
| id | estRows | estCost | actRows | task | access object | execution info | operator info | memory | disk |
| StreamAgg_12 | 1.00 | 1795919.60 | 1 | root | | time:8.28s, loops:2 | funcs:count(1)->Column#48 | 28.7 KB | N/A |
| └─TableReader_24 | 0.29 | 1795905.35 | 3369270 | root | | time:8.21s, loops:3302, cop_task: {num: 59, max: 0s, min: 0s, avg: 0s, p95: 0s, copr_cache_hit_ratio: 0.00} | MppVersion: 2, data:ExchangeSender_23 | 1.87 MB | N/A |
| └─ExchangeSender_23 | 0.29 | 26938469.76 | 3369270 | mpp[tiflash] | | tiflash_task:{time:64.2ms, loops:58, threads:16} | ExchangeType: PassThrough | N/A | N/A |
| └─Selection_22 | 0.29 | 26938469.76 | 3369270 | mpp[tiflash] | | tiflash_task:{time:57.2ms, loops:58, threads:16} | eq(environment_uun000000000001.record_stress__t.string5, “Alice5”), eq(environment_uun000000000001.record_stress__t.string6, “Alice6”) | N/A | N/A |
| └─TableFullScan_21 | 285485.00 | 25568141.76 | 3369270 | mpp[tiflash] | table:record_stress__t | tiflash_task:{time:56.2ms, loops:58, threads:16}, tiflash_wait: {pipeline_queue_wait: 28ms}, tiflash_scan:{mvcc_input_rows:0, mvcc_input_bytes:0, mvcc_output_rows:0, lm_skip_rows:0, local_regions:15, remote_regions:0, tot_learner_read:4ms, region_balance:{instance_num: 1, max/min: 15/15=1.000000}, delta_rows:0, delta_bytes:0, segments:14, stale_read_regions:0, tot_build_snapshot:0ms, tot_build_bitmap:118ms, tot_build_inputstream:124ms, min_local_stream:17ms, max_local_stream:50ms, dtfile:{data_scanned_rows:3465223, data_skipped_rows:0, mvcc_scanned_rows:395664, mvcc_skipped_rows:552263, lm_filter_scanned_rows:0, lm_filter_skipped_rows:0, tot_rs_index_check:0ms, tot_read:212ms}} | keep order:false, stats:pseudo | N/A | N/A |
看起来都是在tiflash里面执行的
SELECT /*+ HASH_AGG() / count() 加个hint看下呢?
1 个赞
嗯 那看下来就是优化器选择路径的问题。用楼上的方案强制走 hash agg 试试吧
/*+ HASH_AGG() */
加了以后就快了,这属于BUG吗