【TiDB 使用环境】生产环境
【TiDB 版本】V7.1.0
【操作系统】centos7.9
【部署方式】物理机
【集群数据量】41T
【集群节点数】14
【问题复现路径】重启tidb集群
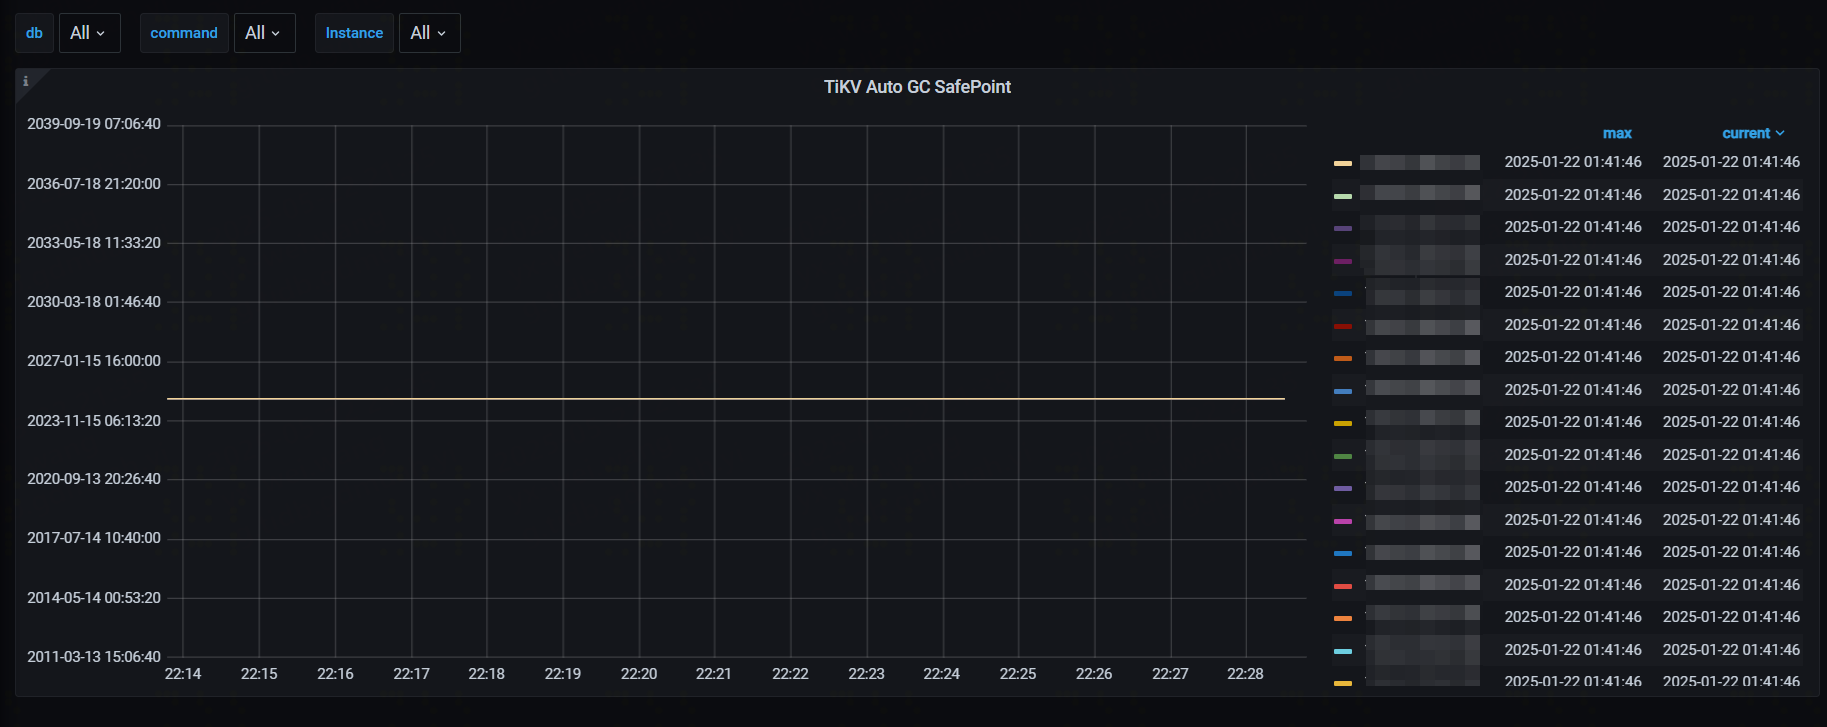
【遇到的问题:问题现象及影响】tidb grafana监控查看GC safe point未正常推进
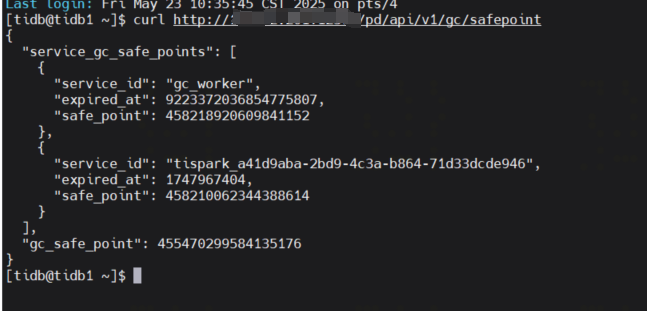
PD记录的safe point
curl http://<PD_IP>:<PD_PORT>/pd/api/v1/gc/safepoint
“gc_safe_point”: 455470299584135176
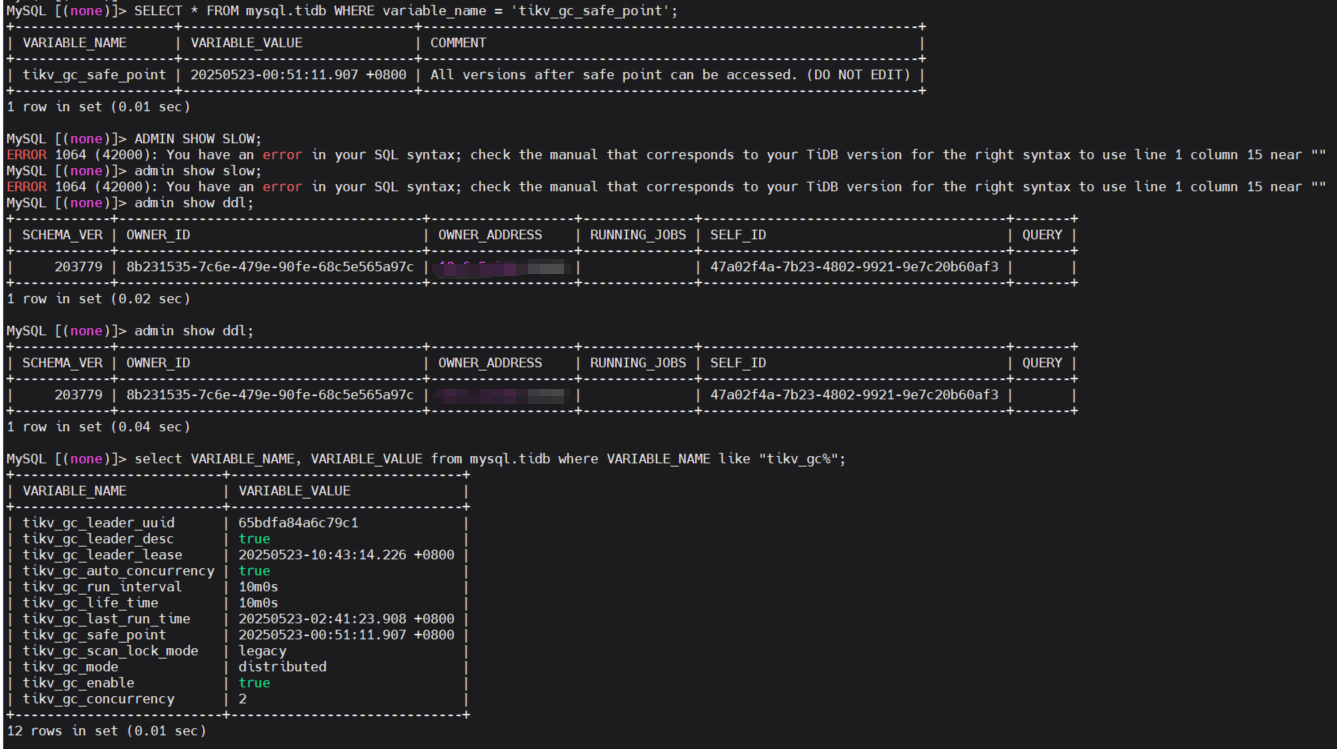
TiDB记录的safe point
SELECT * FROM mysql.tidb WHERE variable_name=‘tikv_gc_safe_point’;
| tikv_gc_safe_point | 20250522-21:37:24.208 +0800 | All versions after safe point can be accessed. (DO NOT EDIT)
TiKV各节点状态
tiup ctl:v<CLUSTER_VERSION> tikv --host=<TiKV_IP>:<TiKV_STATUS_PORT> metrics | grep gc_safe_point
HELP tikv_gcworker_autogc_safe_point Safe point used for auto gc
TYPE tikv_gcworker_autogc_safe_point gauge
tikv_gcworker_autogc_safe_point 455470299584135200
tikv_pd_request_duration_seconds_bucket{type=“get_gc_safe_point”,le=“0.005”} 706
tikv_pd_request_duration_seconds_bucket{type=“get_gc_safe_point”,le=“0.01”} 710
tikv_pd_request_duration_seconds_bucket{type=“get_gc_safe_point”,le=“0.025”} 713
tikv_pd_request_duration_seconds_bucket{type=“get_gc_safe_point”,le=“0.05”} 713
tikv_pd_request_duration_seconds_bucket{type=“get_gc_safe_point”,le=“0.1”} 713
tikv_pd_request_duration_seconds_bucket{type=“get_gc_safe_point”,le=“0.25”} 713
tikv_pd_request_duration_seconds_bucket{type=“get_gc_safe_point”,le=“0.5”} 713
tikv_pd_request_duration_seconds_bucket{type=“get_gc_safe_point”,le=“1”} 713
tikv_pd_request_duration_seconds_bucket{type=“get_gc_safe_point”,le=“2.5”} 713
tikv_pd_request_duration_seconds_bucket{type=“get_gc_safe_point”,le=“5”} 713
tikv_pd_request_duration_seconds_bucket{type=“get_gc_safe_point”,le=“10”} 713
tikv_pd_request_duration_seconds_bucket{type=“get_gc_safe_point”,le=“+Inf”} 713
tikv_pd_request_duration_seconds_sum{type=“get_gc_safe_point”} 1.0915107170000005
tikv_pd_request_duration_seconds_count{type=“get_gc_safe_point”} 713
- 三方safe point不一致
- PD记录:
455470299584135176(2025-01-22左右) - TiDB记录:
20250522-21:37:24.208 +0800(2025-05-22) - TiKV记录:
455470299584135200(与PD接近)
*通过GRAFANA查看与PD结果也一致,一致未推进
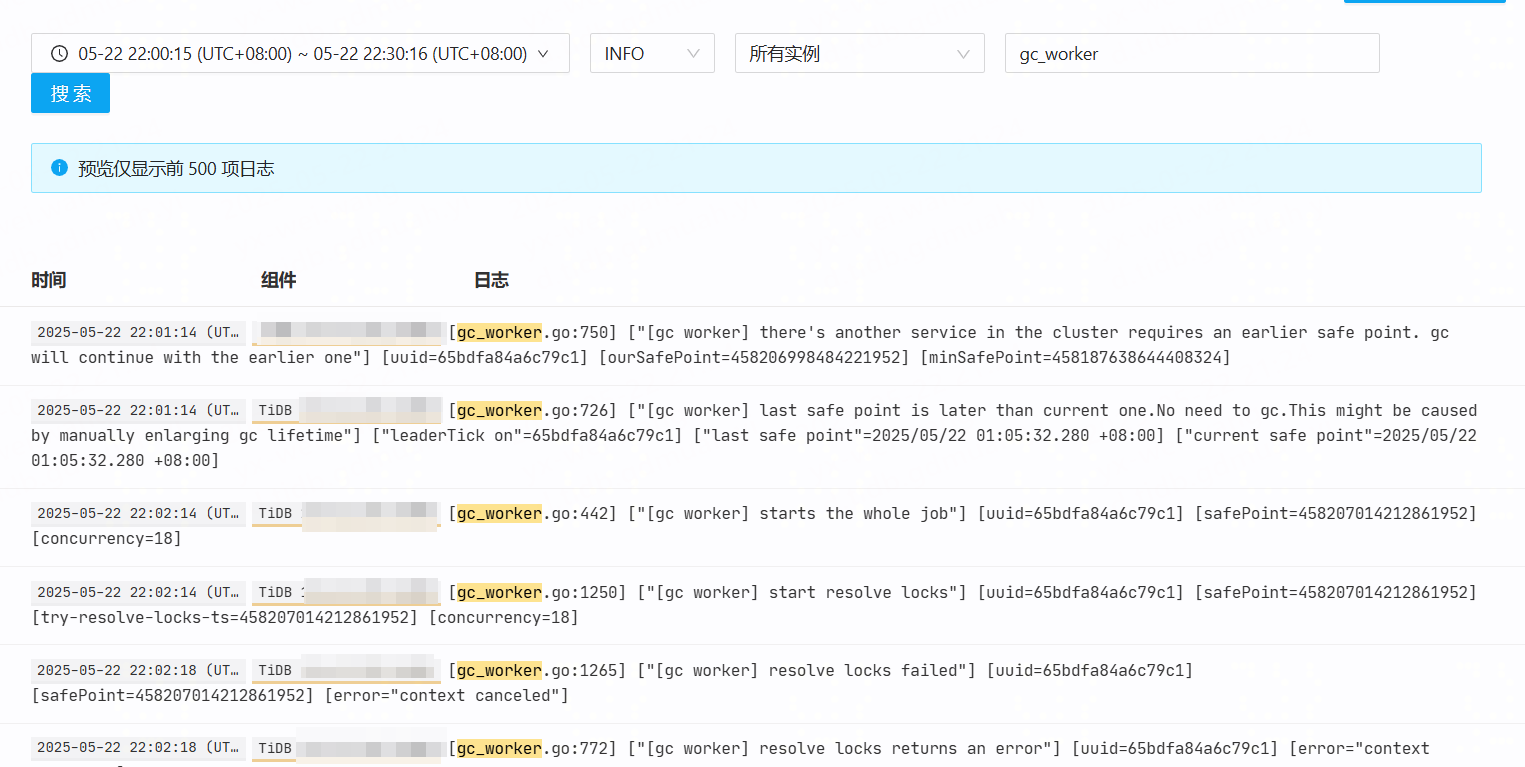
通过tidb日志查看GC是有正常推进的
期间有重启tidb集群和重启tidb server节点都无用