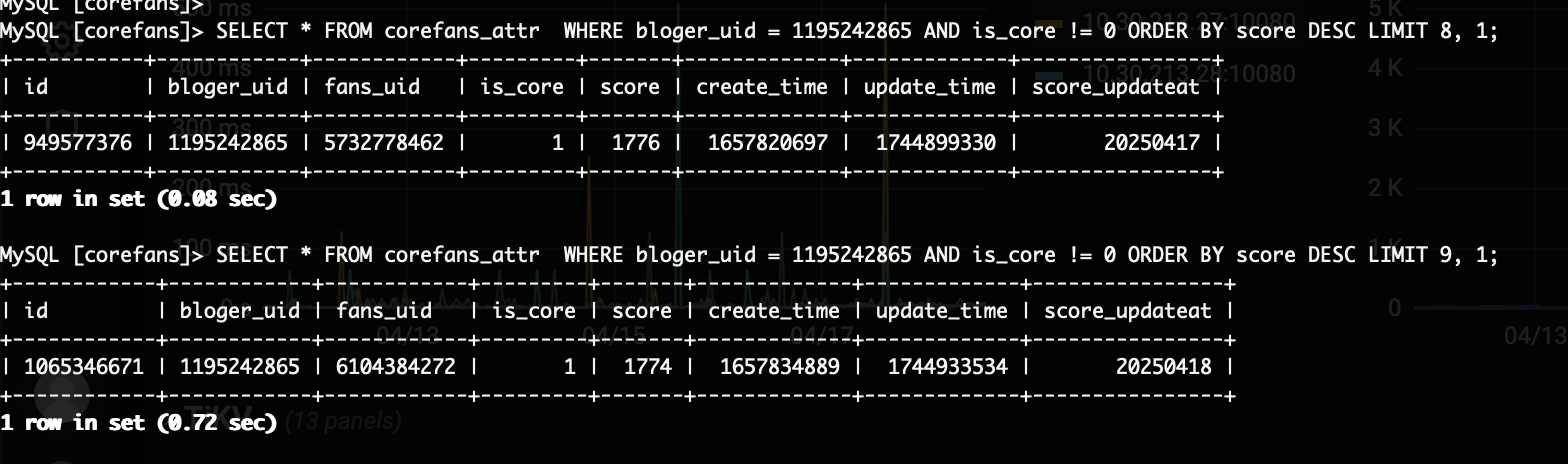
碰到一个走联合索引order by limit 慢的问题,现象是limit 9 速度还行,limit 10
就会变得慢很多,执行计划走的索引没变化,region可能变了
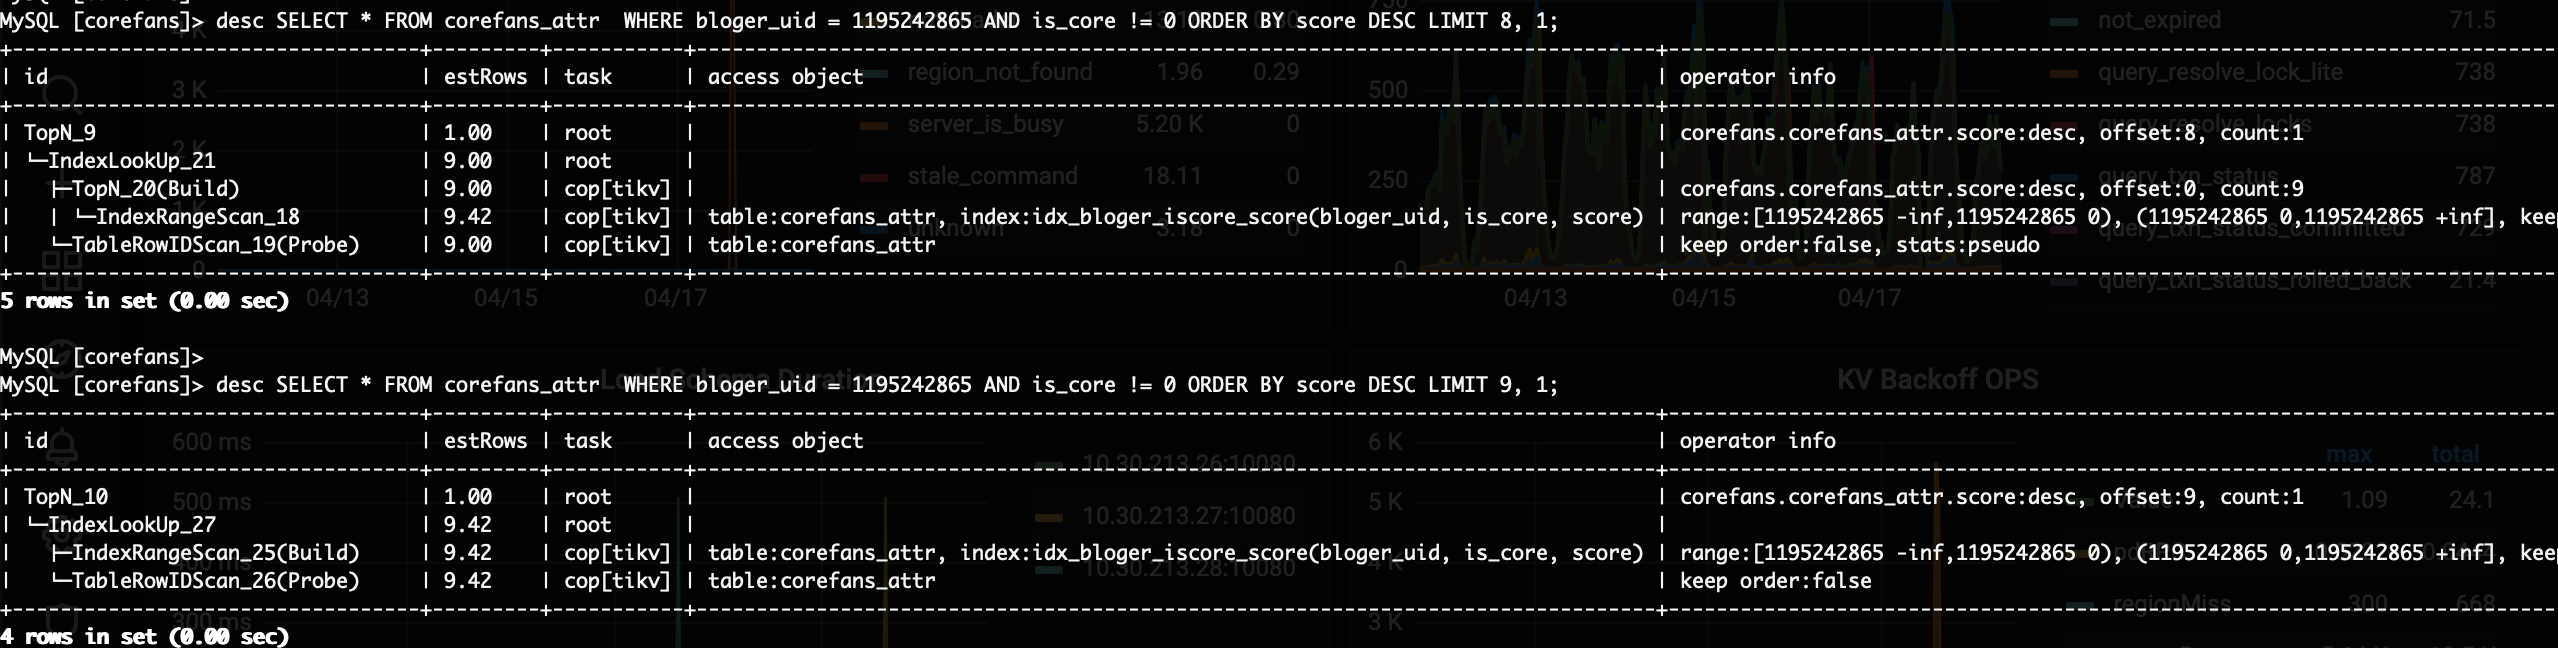
补充一下详细的执行计划
explain analyze SELECT * FROM corefans_attr WHERE bloger_uid = 1195242865 AND is_core != 0 ORDER BY score DESC LIMIT 8, 1\G
*************************** 1. row ***************************
id: TopN_9
estRows: 1.00
actRows: 1
task: root
access object:
execution info: time:780.4ms, loops:2
operator info: corefans.corefans_attr.score:desc, offset:8, count:1
memory: 2.98 KB
disk: N/A
*************************** 2. row ***************************
id: └─IndexLookUp_21
estRows: 9.00
actRows: 9
task: root
access object:
execution info: time:763.6ms, loops:2, index_task: {total_time: 161.3ms, fetch_handle: 161.3ms, build: 1.15µs, wait: 8.33µs}, table_task: {total_time: 3.35s, num: 1, concurrency: 16}
operator info:
memory: 3.12 KB
disk: N/A
*************************** 3. row ***************************
id: ├─TopN_20(Build)
estRows: 9.00
actRows: 9
task: cop[tikv]
access object:
execution info: time:161.3ms, loops:2, cop_task: {num: 2, max: 158.3ms, min: 3.36ms, avg: 80.8ms, p95: 158.3ms, max_proc_keys: 86899, p95_proc_keys: 86899, tot_proc: 97ms, rpc_num: 2, rpc_time: 161.7ms, copr_cache: disabled}, tikv_task:{proc max:97ms, min:0s, p80:97ms, p95:97ms, iters:86, tasks:2}, scan_detail: {total_process_keys: 86899, total_keys: 87897}
operator info: corefans.corefans_attr.score:desc, offset:0, count:9
memory: N/A
disk: N/A
*************************** 4. row ***************************
id: │ └─IndexRangeScan_18
estRows: 9.41
actRows: 86899
task: cop[tikv]
access object: table:corefans_attr, index:idx_bloger_iscore_score(bloger_uid, is_core, score)
execution info: tikv_task:{proc max:82ms, min:0s, p80:82ms, p95:82ms, iters:86, tasks:2}
operator info: range:[1195242865 -inf,1195242865 0), (1195242865 0,1195242865 +inf], keep order:false
memory: N/A
disk: N/A
*************************** 5. row ***************************
id: └─TableRowIDScan_19(Probe)
estRows: 9.00
actRows: 9
task: cop[tikv]
access object: table:corefans_attr
execution info: time:574.7ms, loops:2, cop_task: {num: 7, max: 448.2ms, min: 3.54ms, avg: 86.9ms, p95: 448.2ms, max_proc_keys: 2, p95_proc_keys: 2, rpc_num: 7, rpc_time: 607.9ms, copr_cache: disabled}, tikv_task:{proc max:0s, min:0s, p80:0s, p95:0s, iters:7, tasks:7}, scan_detail: {total_process_keys: 9, total_keys: 9}
operator info: keep order:false, stats:pseudo
memory: N/A
disk: N/A
5 rows in set (0.78 sec)
explain analyze SELECT * FROM corefans_attr WHERE bloger_uid = 1195242865 AND is_core != 0 ORDER BY score DESC LIMIT 9, 1\G
*************************** 1. row ***************************
id: TopN_10
estRows: 1.00
actRows: 1
task: root
access object:
execution info: time:3.75s, loops:2
operator info: corefans.corefans_attr.score:desc, offset:9, count:1
memory: 20.4 KB
disk: N/A
*************************** 2. row ***************************
id: └─IndexLookUp_27
estRows: 9.41
actRows: 86900
task: root
access object:
execution info: time:3.75s, loops:87, index_task: {total_time: 607.6ms, fetch_handle: 607.6ms, build: 9.26µs, wait: 17µs}, table_task: {total_time: 33.1s, num: 14, concurrency: 16}
operator info:
memory: 8.12 MB
disk: N/A
*************************** 3. row ***************************
id: ├─IndexRangeScan_25(Build)
estRows: 9.41
actRows: 86900
task: cop[tikv]
access object: table:corefans_attr, index:idx_bloger_iscore_score(bloger_uid, is_core, score)
execution info: time:606.8ms, loops:91, cop_task: {num: 2, max: 606.8ms, min: 3.14ms, avg: 305ms, p95: 606.8ms, max_proc_keys: 86900, p95_proc_keys: 86900, tot_proc: 596ms, tot_wait: 1ms, rpc_num: 2, rpc_time: 609.9ms, copr_cache: disabled}, tikv_task:{proc max:68ms, min:1ms, p80:68ms, p95:68ms, iters:90, tasks:2}, scan_detail: {total_process_keys: 86900, total_keys: 87920}
operator info: range:[1195242865 -inf,1195242865 0), (1195242865 0,1195242865 +inf], keep order:false
memory: N/A
disk: N/A
*************************** 4. row ***************************
id: └─TableRowIDScan_26(Probe)
estRows: 9.41
actRows: 86900
task: cop[tikv]
access object: table:corefans_attr
execution info: time:23.3s, loops:104, cop_task: {num: 7022, max: 2.91s, min: 339.5µs, avg: 23.2ms, p95: 46.5ms, max_proc_keys: 2458, p95_proc_keys: 35, tot_proc: 1m18.3s, tot_wait: 1m7.9s, rpc_num: 7022, rpc_time: 2m42.9s, copr_cache: disabled}, tikv_task:{proc max:56ms, min:0s, p80:1ms, p95:3ms, iters:7594, tasks:7022}, scan_detail: {total_process_keys: 86900, total_keys: 88884}
operator info: keep order:false
memory: N/A
disk: N/A
4 rows in set (3.76 sec)
【TiDB 使用环境】生产环境 /测试/ Poc
【TiDB 版本】v4.0.16
【操作系统】
【部署方式】云上部署(什么云)/机器部署(什么机器配置、什么硬盘)
【集群数据量】
【集群节点数】
【问题复现路径】做过哪些操作出现的问题
【遇到的问题:问题现象及影响】
【资源配置】进入到 TiDB Dashboard -集群信息 (Cluster Info) -主机(Hosts) 截图此页面
【复制黏贴 ERROR 报错的日志】
【其他附件:截图/日志/监控】