【 TiDB 使用环境】生产
【 TiDB 版本】7.1.2, 7.5.1
【复现路径】做过哪些操作出现的问题
【遇到的问题:问题现象及影响】
ticdc的prometheus监控指标怎么突然就没了
ticdc_processor_checkpoint_ts这个指标在6.5.1版本还能查到。升级到了7.1.2和7.5.1之后就没有了
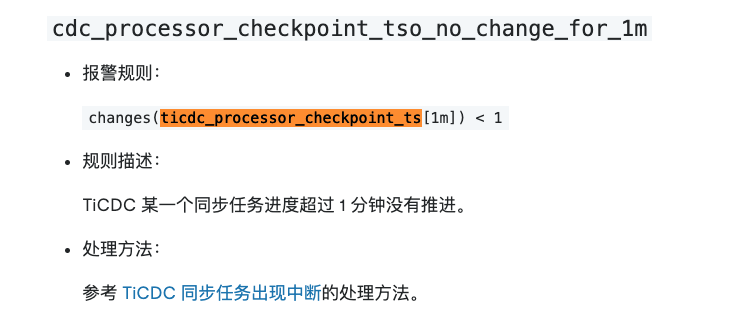
这个是7.5.1的ticdc.rules.yml告警规则,里面没有ticdc_processor_checkpoint_ts了,我们之前的告警是基于ticdc_processor_checkpoint_ts这个指标的,现在升级之后没有了,导致cdc断更2天了没有告警。但是官我看方文档还在https://docs.pingcap.com/zh/tidb/v7.5/ticdc-alert-rules#cdc_processor_checkpoint_tso_no_change_for_1m
groups:
- name: alert.rules
  rules:
  # server related alter rules
  - alert: cdc_multiple_owners
    expr: sum(rate(ticdc_owner_ownership_counter[30s])) >= 2
    for: 1m
    labels:
      env: 8394e088-e799-4e24-aaec-d39c6a75ee38
      level: warning
      expr: sum(rate(ticdc_owner_ownership_counter[30s])) >= 2
    annotations:
      description: 'cluster: 8394e088-e799-4e24-aaec-d39c6a75ee38, instance: {{ $labels.instance }}, values: {{ $value }}'
      value: '{{ $value }}'
      summary: cdc cluster has multiple owners

  - alert: cdc_no_owner
    expr: sum(rate(ticdc_owner_ownership_counter[30s])) < 0.5
    for: 10m
    labels:
      env: 8394e088-e799-4e24-aaec-d39c6a75ee38
      level: warning
      expr: sum(rate(ticdc_owner_ownership_counter[30s])) < 0.5
    annotations:
      description: 'cluster: 8394e088-e799-4e24-aaec-d39c6a75ee38, instance: {{ $labels.instance }}, values: {{ $value }}'
      value: '{{ $value }}'
      summary: cdc cluster has no owner for more than 10 minutes

  # changefeed related alter rules
  - alert: ticdc_changefeed_failed
    expr: (max_over_time(ticdc_owner_status[1m]) == 2) > 0
    for: 1m
    labels:
      env: 8394e088-e799-4e24-aaec-d39c6a75ee38
      level: critical
      expr: (max_over_time(ticdc_owner_status[1m]) == 2) > 0
    annotations:
      description: 'cluster: 8394e088-e799-4e24-aaec-d39c6a75ee38, instance: {{ $labels.instance }}, values: {{ $value }}'
      value: '{{ $value }}'
      summary: cdc changefeed failed, it can not be automatically resumed

  - alert: cdc_checkpoint_high_delay
    expr: ticdc_owner_checkpoint_ts_lag > 600
    for: 1m
    labels:
      env: 8394e088-e799-4e24-aaec-d39c6a75ee38
      level: critical
      expr: ticdc_owner_checkpoint_ts_lag > 600
    annotations:
      description: 'cluster: 8394e088-e799-4e24-aaec-d39c6a75ee38, instance: {{ $labels.instance }}, values: {{ $value }}'
      value: '{{ $value }}'
      summary: cdc owner checkpoint delay more than 10 minutes

  - alert: cdc_resolvedts_high_delay
    expr: ticdc_owner_resolved_ts_lag > 300
    for: 1m
    labels:
      env: 8394e088-e799-4e24-aaec-d39c6a75ee38
      level: critical
      expr: ticdc_owner_resolved_ts_lag > 300
    annotations:
      description: 'cluster: 8394e088-e799-4e24-aaec-d39c6a75ee38, instance: {{ $labels.instance }}, values: {{ $value }}'
      value: '{{ $value }}'
      summary: cdc owner resolved ts delay more than 5 minutes

  - alert: ticdc_sink_execution_error
    expr: changes(ticdc_sink_execution_error[1m]) > 0
    for: 1m
    labels:
      env: 8394e088-e799-4e24-aaec-d39c6a75ee38
      level: warning
      expr: changes(ticdc_sink_execution_error[1m]) > 0
    annotations:
      description: 'cluster: 8394e088-e799-4e24-aaec-d39c6a75ee38, instance: {{ $labels.instance }}, values: {{ $value }}'
      value: '{{ $value }}'
      summary: cdc sink execution meets errors

  - alert: ticdc_processor_exit_with_error_count
    expr: changes(ticdc_processor_exit_with_error_count[1m]) > 0
    for: 1m
    labels:
      env: 8394e088-e799-4e24-aaec-d39c6a75ee38
      level: warning
      expr: changes(ticdc_processor_exit_with_error_count[1m]) > 0
    annotations:
      description: 'cluster: 8394e088-e799-4e24-aaec-d39c6a75ee38, instance: {{ $labels.instance }}, values: {{ $value }}'
      value: '{{ $value }}'
      summary: cdc processor exits with error

  - alert: ticdc_changefeed_meet_error
    expr: (max_over_time(ticdc_owner_status[1m]) == 1) > 0
    for: 1m
    labels:
      env: 8394e088-e799-4e24-aaec-d39c6a75ee38
      level: warning
      expr: (max_over_time(ticdc_owner_status[1m]) == 1) > 0
    annotations:
      description: 'cluster: 8394e088-e799-4e24-aaec-d39c6a75ee38, instance: {{ $labels.instance }}, values: {{ $value }}'
      value: '{{ $value }}'
      summary: cdc changefeed meet error

  # tikv related alter rules
  - alert: tikv_cdc_min_resolved_ts_no_change_for_1m
    expr: changes(tikv_cdc_min_resolved_ts[1m]) < 1 and ON (instance) tikv_cdc_region_resolve_status{status="resolved"} > 0 and ON (instance) tikv_cdc_captured_region_total > 0
    for: 1m
    labels:
      env: 8394e088-e799-4e24-aaec-d39c6a75ee38
      level: warning
      expr: changes(tikv_cdc_min_resolved_ts[1m]) < 1 and ON (instance) tikv_cdc_region_resolve_status{status="resolved"} > 0
    annotations:
      description: 'cluster: 8394e088-e799-4e24-aaec-d39c6a75ee38, instance: {{ $labels.instance }}, values: {{ $value }}'
      value: '{{ $labels.instance }}'
      summary: tikv cdc min resolved ts no change for 1m

  - alert: tikv_cdc_scan_duration_seconds_more_than_10min
    expr: histogram_quantile(0.9, rate(tikv_cdc_scan_duration_seconds_bucket{}[1m])) > 600
    for: 1m
    labels:
      env: 8394e088-e799-4e24-aaec-d39c6a75ee38
      level: warning
      expr: histogram_quantile(0.9, rate(tikv_cdc_scan_duration_seconds_bucket{}[1m])) > 600
    annotations:
      description: 'cluster: 8394e088-e799-4e24-aaec-d39c6a75ee38, instance: {{ $labels.instance }}, values: {{ $value }}'
      value: '{{ $value }}'
      summary: tikv cdc scan duration seconds more than 10 min

  - alert: ticdc_memory_abnormal
    expr: go_memstats_heap_alloc_bytes{job="ticdc"} > 1e+10
    for: 1m
    labels:
      env: 8394e088-e799-4e24-aaec-d39c6a75ee38
      level: warning
      expr: go_memstats_heap_alloc_bytes{job="ticdc"} > 1e+10
    annotations:
      description: 'cluster: 8394e088-e799-4e24-aaec-d39c6a75ee38, instance: {{ $labels.instance }}, values:{{ $value }}'
      value: '{{ $value }}'
      summary: TiCDC heap memory usage is over 10 GB
【资源配置】进入到 TiDB Dashboard -集群信息 (Cluster Info) -主机(Hosts) 截图此页面
【附件:截图/日志/监控】