【 TiDB 使用环境】生产环境
【 TiDB 版本】v6.5.1
【复现路径】
单节点的tiflash,表同步已经取消,scale-in一直在Pending Offline,正常吗
tiflash 副本配置都为 0 了嘛
不正常,看下还有 region 吗
是的, 都设置成0了
磁盘空间大小 没变,怎么看还有没有region啊
pd-ctl 输入 store ,看region_count 是不是为 0 了
调整数据表的副本数
alter table db-name.table-name set tiflash replica 0;
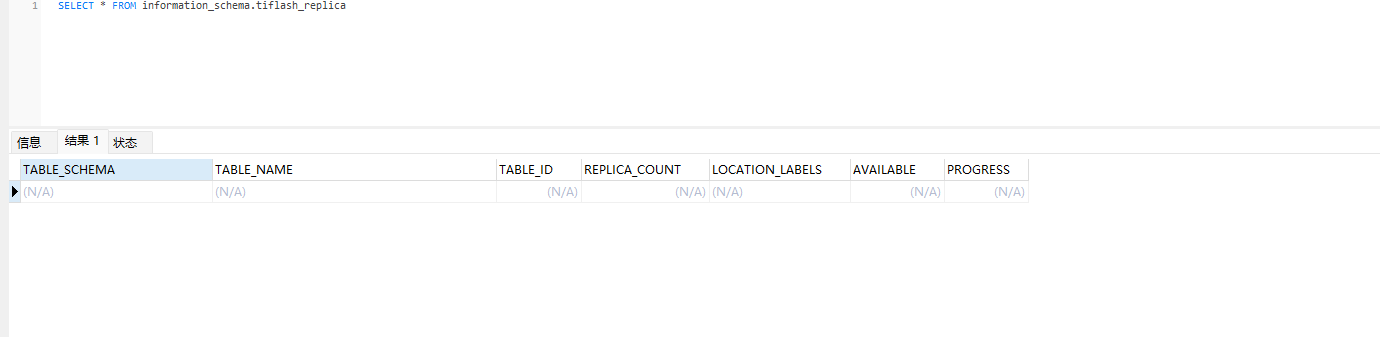
确认表的副本已经被删除
SELECT * FROM information_schema.tiflash_replica WHERE TABLE_SCHEMA =‘<db_name>’ and TABLE_NAME =‘<table_name>’
tiup cluster display
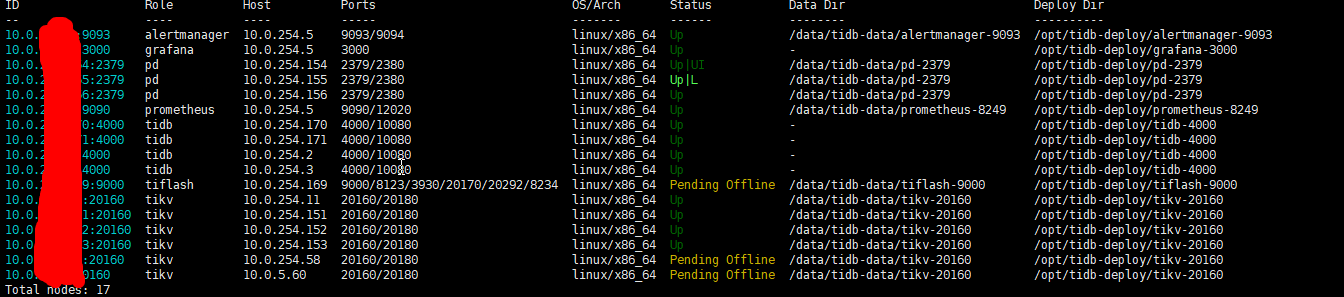
这是在做什么 两个 tikv 同时下线?
是的,一共有6个TIKV
不建议这么玩,TiKV 最好一个个下线
下线太慢了,时间来不急了 ![]()
-
数据平衡:TiKV 使用 Region 来分割数据,每个 Region 包含一定范围的数据。缩容时,需要确保数据在剩余节点之间均匀分布,避免数据倾斜。
-
数据迁移:在缩容过程中,需要将下线节点的数据迁移到其他节点上。这个过程需要逐个节点进行,以确保数据迁移的平稳和正确性。
-
避免脑裂:如果同时下线多个节点,可能会导致集群中的不同部分无法达成共识,从而引发脑裂现象,影响集群的稳定性。
咋同时搞,tikv的看这个
TiKV 下线时间太慢,你加快调度,调整参数
{
“store”: {
“id”: 83865386,
“address”: “xxx:3930”,
“labels”: [
{
“key”: “engine”,
“value”: “tiflash”
}
],
“version”: “v6.5.1”,
“peer_address”: “xxx:20170”,
“status_address”: “xxx:20292”,
“git_hash”: “d8f4fe1595750a5b8ba103dd5b4a515205489fe2”,
“start_timestamp”: 1714032949,
“deploy_path”: “/opt/tidb-deploy/tiflash-9000/bin/tiflash”,
“last_heartbeat”: 1719543104973779552,
“state_name”: “Offline”
},
“status”: {
“capacity”: “799.8GiB”,
“available”: “493.9GiB”,
“used_size”: “277GiB”,
“leader_count”: 0,
“leader_weight”: 1,
“leader_score”: 0,
“leader_size”: 0,
“region_count”: 12294,
“region_weight”: 1,
“region_score”: 1699090.634955347,
“region_size”: 1193956,
“witness_count”: 0,
“slow_score”: 1,
“start_ts”: “2024-04-25T16:15:49+08:00”,
“last_heartbeat_ts”: “2024-06-28T10:51:44.973779552+08:00”,
“uptime”: “1530h35m55.973779552s”
}
}
tiflash 的 region_count 在减小嘛,还是卡着不动了
{
“store”: {
“id”: 15577117,
“address”: “10.0.5.60:20160”,
“version”: “6.5.1”,
“peer_address”: “xxx:20160”,
“status_address”: “xxx:20180”,
“git_hash”: “bc3e311060be390c16c66172ae86c9f34a28c72f”,
“start_timestamp”: 1719303646,
“deploy_path”: “/opt/tidb-deploy/tikv-20160/bin”,
“last_heartbeat”: 1719543104576181460,
“state_name”: “Offline”
},
“status”: {
“capacity”: “6.44TiB”,
“available”: “2.13TiB”,
“used_size”: “3.933TiB”,
“leader_count”: 137986,
“leader_weight”: 1,
“leader_score”: 137986,
“leader_size”: 12751246,
“region_count”: 304425,
“region_weight”: 1,
“region_score”: 30337895.533019226,
“region_size”: 28393393,
“witness_count”: 0,
“slow_score”: 1,
“start_ts”: “2024-06-25T16:20:46+08:00”,
“last_heartbeat_ts”: “2024-06-28T10:51:44.57618146+08:00”,
“uptime”: “66h30m58.57618146s”
}