【 TiDB 使用环境】生产环境 /测试/ Poc
【 TiDB 版本】v7.1.5
【遇到的问题:问题现象及影响】
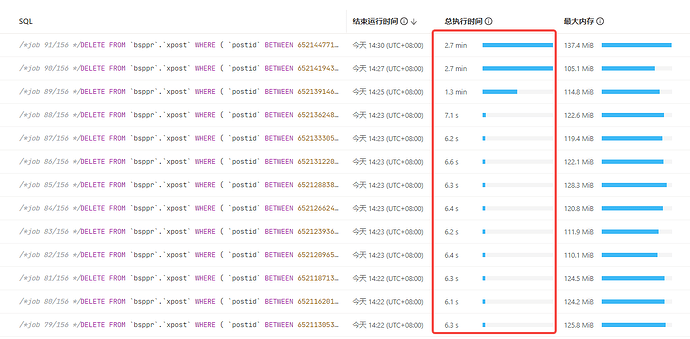
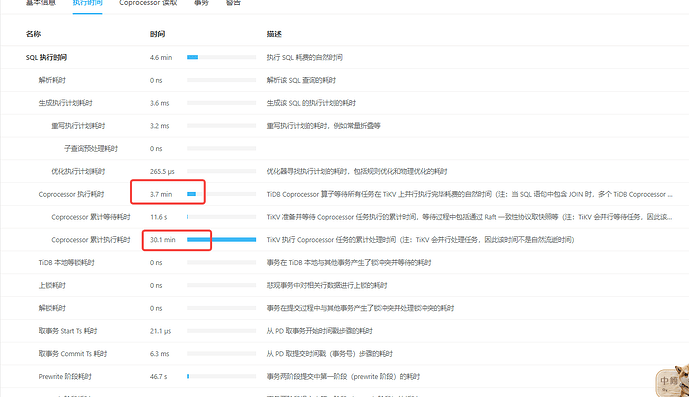
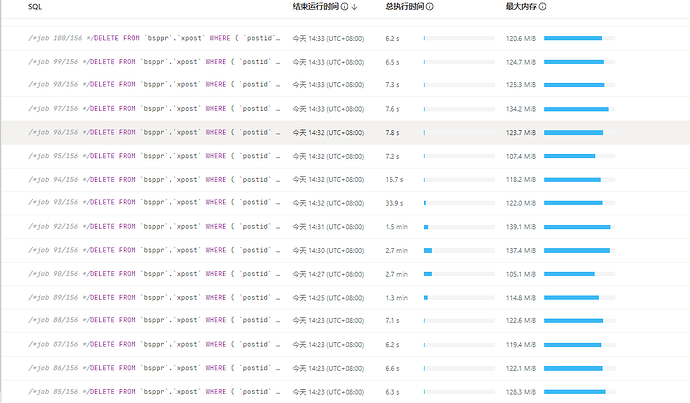
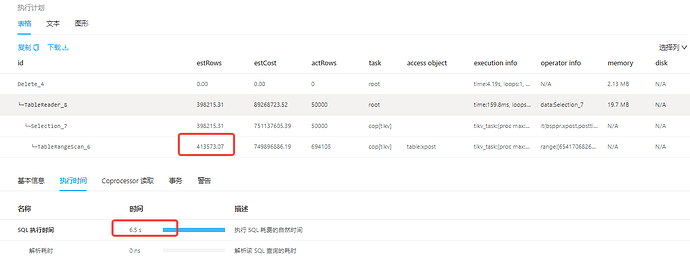
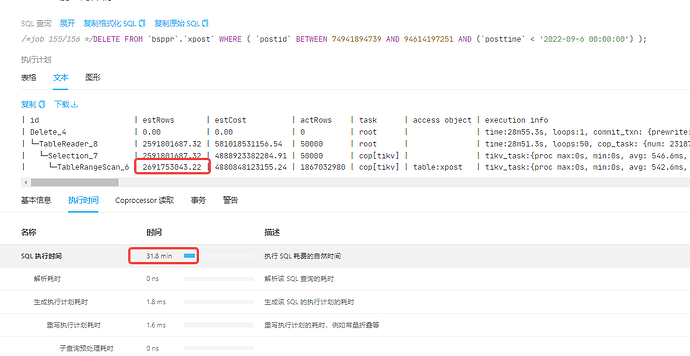
batch ddl进行历史数据清理,通过dashboard看到不同job执行时间差距巨大,想请教下这个可能原因有哪些?原因查找及如何优化呢
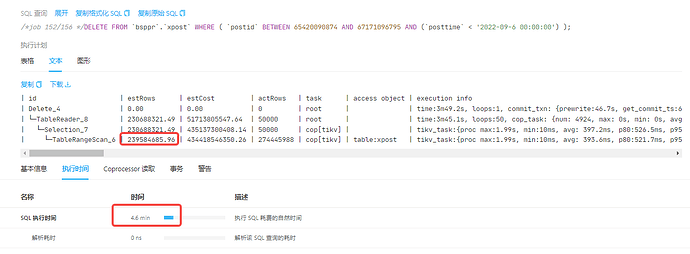
| id                     | estRows      | estCost         | actRows   | task      | access object | execution info                                                                                                                                                                                                                                                                                                                                                                                                                                                                                                                                                                                                                                                                                                                                                                                                                                                                                                                                                                                                                                                                                                                                                                                                                                                                                                             | operator info                                        | memory  | disk  |
| Delete_4               | 0.00         | 0.00            | 0         | root      |               | time:3m49.2s, loops:1, commit_txn: {prewrite:46.7s, get_commit_ts:6.3ms, commit:297.5ms, backoff: {time: 2ms, prewrite type: [regionMiss]}, slowest_prewrite_rpc: {total: 2.891s, region_id: 9894450, store: 192.168.241.73:20160, tikv_wall_time: 1.07s, scan_detail: {get_snapshot_time: 490.3µs, rocksdb: {block: {cache_hit_count: 5343, read_count: 29, read_byte: 1.87 MB, read_time: 12.6ms}}}, write_detail: {store_batch_wait: 1.04ms, propose_send_wait: 0s, persist_log: {total: 242.6µs, write_leader_wait: 455ns, sync_log: 145.8µs, write_memtable: 1.79µs}, commit_log: 8.33ms, apply_batch_wait: 15.7µs, apply: {total:2.39ms, mutex_lock: 0s, write_leader_wait: 43.9µs, write_wal: 104.7µs, write_memtable: 507.2µs}}}, commit_primary_rpc: {total: 0.048s, region_id: 5569392, store: 192.168.241.71:20160, tikv_wall_time: 5.96ms, scan_detail: {get_snapshot_time: 9.01µs, rocksdb: {block: {cache_hit_count: 1}}}, write_detail: {store_batch_wait: 13.3µs, propose_send_wait: 0s, persist_log: {total: 110µs, write_leader_wait: 206ns, sync_log: 58.9µs, write_memtable: 4.12µs}, commit_log: 5.31ms, apply_batch_wait: 18.2µs, apply: {total:98.7µs, mutex_lock: 0s, write_leader_wait: 0s, write_wal: 17µs, write_memtable: 32.9µs}}}, region_num:14141, write_keys:700000, write_byte:36623906} | N/A                                                  | 3.30 MB | N/A   |
| └─TableReader_8        | 230688321.49 | 51713805547.64  | 50000     | root      |               | time:3m45.1s, loops:50, cop_task: {num: 4924, max: 0s, min: 0s, avg: 692.2ms, p95: 1.62s, tot_proc: 30m3.3s, tot_wait: 11.6s, rpc_num: 4924, rpc_time: 56m48.4s, copr_cache_hit_ratio: 0.00, build_task_duration: 2.2s, max_distsql_concurrency: 15}                                                                                                                                                                                                                                                                                                                                                                                                                                                                                                                                                                                                                                                                                                                                                                                                                                                                                                                                                                                                                                                                       | data:Selection_7                                     | 8.75 MB | N/A   |
|   └─Selection_7        | 230688321.49 | 435137300408.14 | 50000     | cop[tikv] |               | tikv_task:{proc max:1.99s, min:10ms, avg: 397.2ms, p80:526.5ms, p95:742.7ms, iters:290274, tasks:4924}, scan_detail: {total_process_keys: 274445988, total_process_keys_size: 337825055131, total_keys: 275092768, get_snapshot_time: 10.2s, rocksdb: {delete_skipped_count: 678094, key_skipped_count: 550436231, block: {cache_hit_count: 120229, read_count: 5747801, read_byte: 114.1 GB, read_time: 2m30.3s}}}                                                                                                                                                                                                                                                                                                                                                                                                                                                                                                                                                                                                                                                                                                                                                                                                                                                                                                        | lt(bsppr.xpost.posttime, 2022-09-06 00:00:00.000000) | N/A     | N/A   |
|     └─TableRangeScan_6 | 239584685.96 | 434418546350.26 | 274445988 | cop[tikv] | table:xpost   | tikv_task:{proc max:1.99s, min:10ms, avg: 393.6ms, p80:521.7ms, p95:736ms, iters:290274, tasks:4924}                                                                                                                                                                                                                                                                                                                                                                                                                                                                                                                                                                                                                                                                                                                                                                                                                                                                                                                                                                                                                                                                                                                                                                                                                       | range:[65420090874,67171096795], keep order:false    | N/A     | N/A   |
