中午已经设置了,在观察中。还有个想法,是把后台自动更新统计信息的时间设置成0点到18点,我现在是0点到5点的
搞错,我只设置了会话级别的。v7.1.1版本,这个参数不支持全局设置 ![]()
我觉得 SQL 不需要走 TiFlash 的 ![]()
目前有些数据量大的查询,走tikv慢了,所以强制走了tiflash
这个 SQL 不需要 Tiflash 吧, Tiflash 主要应对 AP 分析型的负载,而且 AP 型负载不能很高的,你这个 SQL ,感觉走 TiKV 就行了啊
走tikv也可以的,慢了点
走 tikv 的执行计划发出来
| Projection_14 | 1.00 | 96 | root | time:3.23s, loops:6, RU:144650.195552, Concurrency:OFF | round(Column#10, 2)->Column#11, substring(cast(energy.ads_iot_current_value_minute.data_time, var_string(19)), 1, 16)->Column#12, energy.ads_iot_current_value_minute.measure_tag | 8.98 KB | N/A | |
|---|---|---|---|---|---|---|---|---|
| └─Limit_17 | 1.00 | 96 | root | time:3.23s, loops:6 | offset:0, count:200 | N/A | N/A | |
| └─HashAgg_21 | 1.00 | 96 | root | time:3.23s, loops:6, partial_worker:{wall_time:3.22515357s, concurrency:5, task_num:1, tot_wait:16.12498909s, tot_exec:140.601µs, tot_time:16.125159705s, max:3.225110651s, p95:3.225110651s}, final_worker:{wall_time:3.225246275s, concurrency:5, task_num:5, tot_wait:16.125638669s, tot_exec:358.097µs, tot_time:16.126001113s, max:3.225224798s, p95:3.225224798s} | group by:Column#31, Column#32, funcs:sum(Column#28)->Column#10, funcs:firstrow(Column#29)->energy.ads_iot_current_value_minute.measure_tag, funcs:firstrow(Column#30)->energy.ads_iot_current_value_minute.data_time | 69.7 KB | N/A | |
| └─Projection_84 | 119.73 | 96 | root | time:3.22s, loops:2, Concurrency:OFF | energy.ads_iot_current_value_minute.data_value, energy.ads_iot_current_value_minute.measure_tag, energy.ads_iot_current_value_minute.data_time, substring(cast(energy.ads_iot_current_value_minute.data_time, var_string(19)), 1, 16)->Column#31, energy.ads_iot_current_value_minute.measure_tag | 13.2 KB | N/A | |
| └─Selection_25 | 119.73 | 96 | root | time:3.22s, loops:2 | eq(Column#9, 1) | 19.2 KB | N/A | |
| └─Window_28 | 149.67 | 96 | root | time:3.22s, loops:3 | row_number()->Column#9 over(partition by energy.ads_iot_current_value_minute.measure_point_id, energy.ads_iot_current_value_minute.measure_tag, energy.ads_iot_current_value_minute.data_time order by energy.ads_iot_current_value_minute.create_time desc rows between current row and current row) | N/A | N/A | |
| └─Sort_47 | 149.67 | 96 | root | time:3.22s, loops:2 | energy.ads_iot_current_value_minute.measure_point_id, energy.ads_iot_current_value_minute.measure_tag, energy.ads_iot_current_value_minute.data_time, energy.ads_iot_current_value_minute.create_time:desc | 24.9 KB | 0 Bytes | |
| └─IndexLookUp_46 | 149.67 | 96 | root | partition:P_LT_1716566400 | time:3.22s, loops:2, index_task: {total_time: 2.74s, fetch_handle: 2.74s, build: 1.01µs, wait: 5.88µs}, table_task: {total_time: 485.3ms, num: 1, concurrency: 5}, next: {wait_index: 2.74s, wait_table_lookup_build: 416.8µs, wait_table_lookup_resp: 484.9ms} | 33.6 KB | N/A | |
| ├─Selection_44(Build) | 152.66 | 96 | cop[tikv] | time:2.74s, loops:3, cop_task: {num: 124, max: 642.4ms, min: 247.4µs, avg: 313.7ms, p95: 566.1ms, max_proc_keys: 722240, p95_proc_keys: 694594, tot_proc: 38.7s, tot_wait: 26.7ms, rpc_num: 125, rpc_time: 38.9s, copr_cache_hit_ratio: 0.22, build_task_duration: 244.1µs, max_distsql_concurrency: 15}, backoff{regionMiss: 2ms}, tikv_task:{proc max:642ms, min:13ms, avg: 400.6ms, p80:504ms, p95:565ms, iters:60092, tasks:124}, scan_detail: {total_process_keys: 47583075, total_process_keys_size: 8625383333, total_keys: 47583400, get_snapshot_time: 23.1ms, rocksdb: {key_skipped_count: 47620017, block: {cache_hit_count: 191121}}} | eq(energy.ads_iot_current_value_minute.measure_point_id, be06c45012f711ed9eb91c8cf913d9a6), eq(energy.ads_iot_current_value_minute.measure_tag, GEN.P) | N/A | N/A | |
| │ └─IndexRangeScan_42 | 62963692.68 | 60962444 | cop[tikv] | table:ads, index:idx_aicvm_index(data_time, measure_point_id, measure_tag) | tikv_task:{proc max:585ms, min:11ms, avg: 357ms, p80:451ms, p95:507ms, iters:60092, tasks:124} | range:[2024-05-24 00:00:00,2024-05-24 23:59:59], keep order:false | N/A | N/A |
| └─Selection_45(Probe) | 149.67 | 96 | cop[tikv] | time:484.8ms, loops:2, cop_task: {num: 73, max: 480.6ms, min: 0s, avg: 20.2ms, p95: 148.7ms, max_proc_keys: 3, p95_proc_keys: 2, tot_proc: 2.34s, tot_wait: 27.4ms, rpc_num: 16, rpc_time: 1.48s, copr_cache_hit_ratio: 0.00, build_task_duration: 302.6µs, max_distsql_concurrency: 1, max_extra_concurrency: 7, store_batch_num: 57}, tikv_task:{proc max:471ms, min:0s, avg: 32ms, p80:25ms, p95:171ms, iters:73, tasks:73}, scan_detail: {total_process_keys: 96, total_process_keys_size: 14592, total_keys: 96, get_snapshot_time: 26.4ms, rocksdb: {block: {cache_hit_count: 1126, read_count: 168, read_byte: 5.49 MB, read_time: 1.38s}}} | ge(energy.ads_iot_current_value_minute.data_value, 0) | N/A | N/A | |
| └─TableRowIDScan_43 | 152.66 | 96 | cop[tikv] | table:ads | tikv_task:{proc max:471ms, min:0s, avg: 32ms, p80:25ms, p95:171ms, iters:73, tasks:73} | keep order:false | N/A | N/A |
走了索引还要预计执行60962444行?
![]() 那估计应该就是这里的问题。如果返回数据里没有聚合函数,走tikv试试,速度会不会更快?
那估计应该就是这里的问题。如果返回数据里没有聚合函数,走tikv试试,速度会不会更快?
1 个赞
这个索引范围扫描,没有把需要的数据精确过滤出来。
有聚合的,主要原因就是执行计划变了
ads这个表的索引设置不合理,你设置的联合索引为(data_time,measure_point_id, measure_tag),但是你date_time是范围查询,导致后面的两个字段的索引失效了;ads表的联合索引字段顺序应该是(measure_point_id, measure_tag,data_time),这样你三个字段都能走索引,你的索引过滤效果会大大提高。
SQL执行时快时慢,感觉与SQL本身没有关系,应该是其他SQL、接口调用慢影响了该SQL
感谢,我试试
走tiflash的sql,慢的时候,执行计划里task是cop[tiflash]

tiflash_error.log.2024-05-29-16_44_46.634 (41.9 MB)
tiflash_error.log.2024-05-29-16_46_31.695 (20.3 MB)
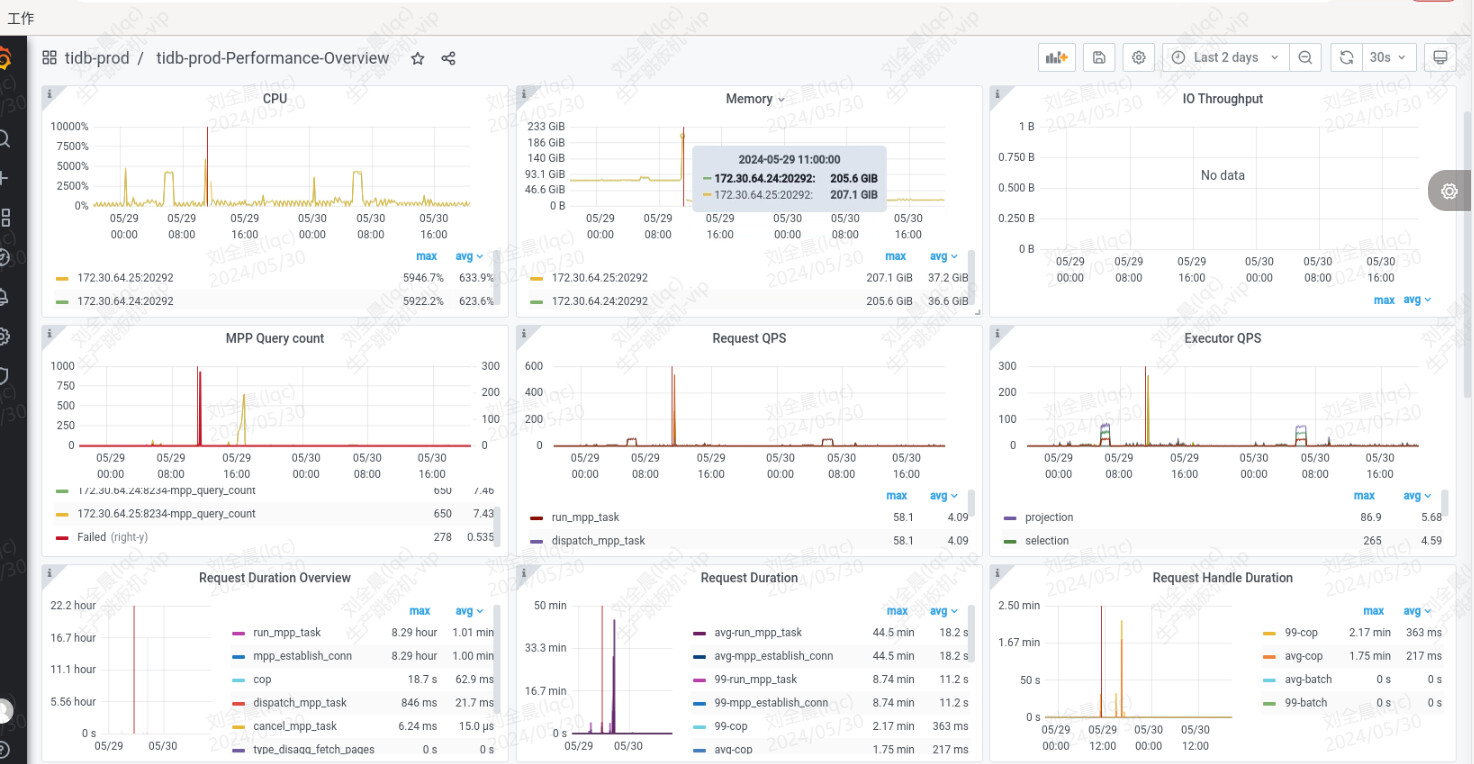
不新开贴了,麻烦大佬们帮忙分析下。昨天中午11点前后,两台tiflash内存爆了重启。
发一下时间段,观察一下近1个月的
好的 ![]()