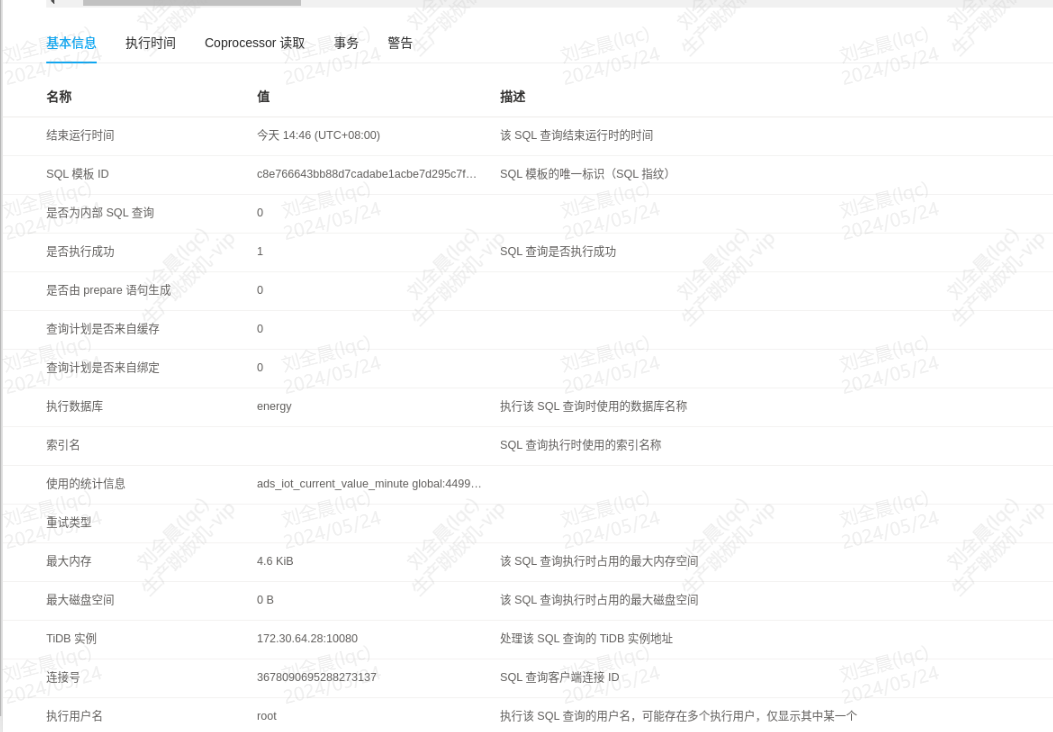
【 TiDB 使用环境】生产环境
【 TiDB 版本】v7.1.1
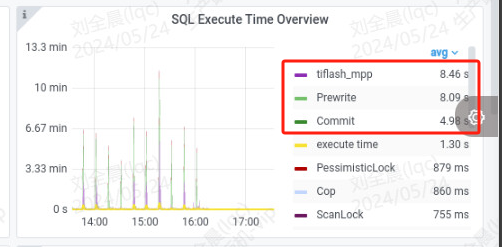
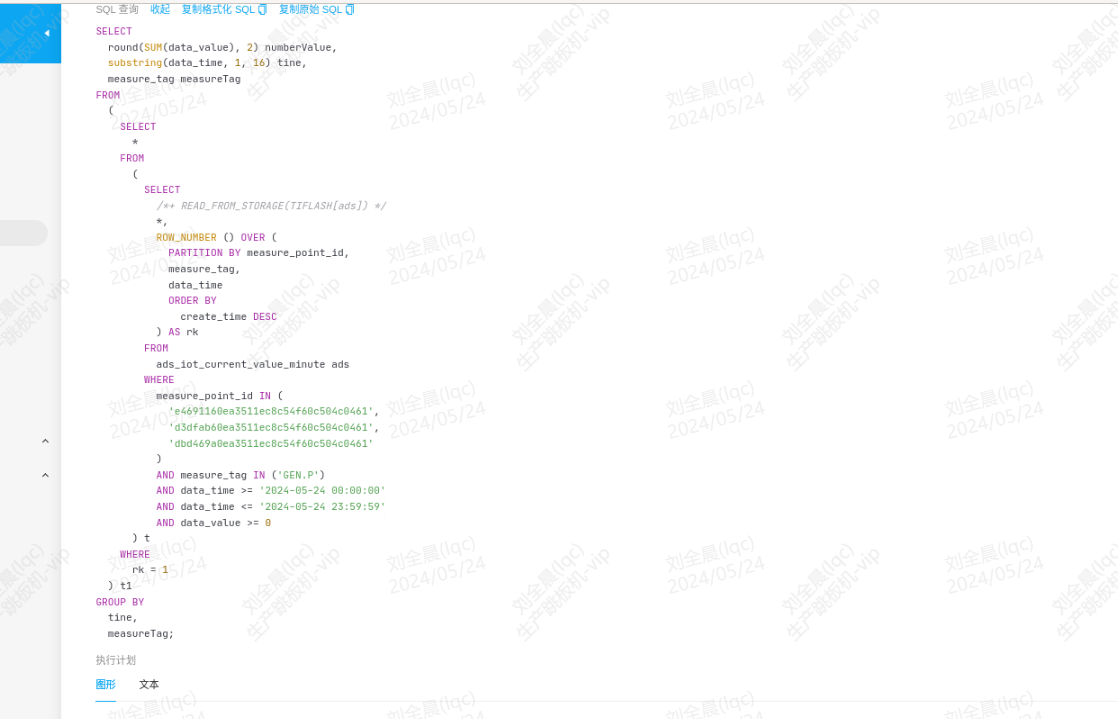
【复现路径】业务接口调用,同个sql会出现时快时慢问题
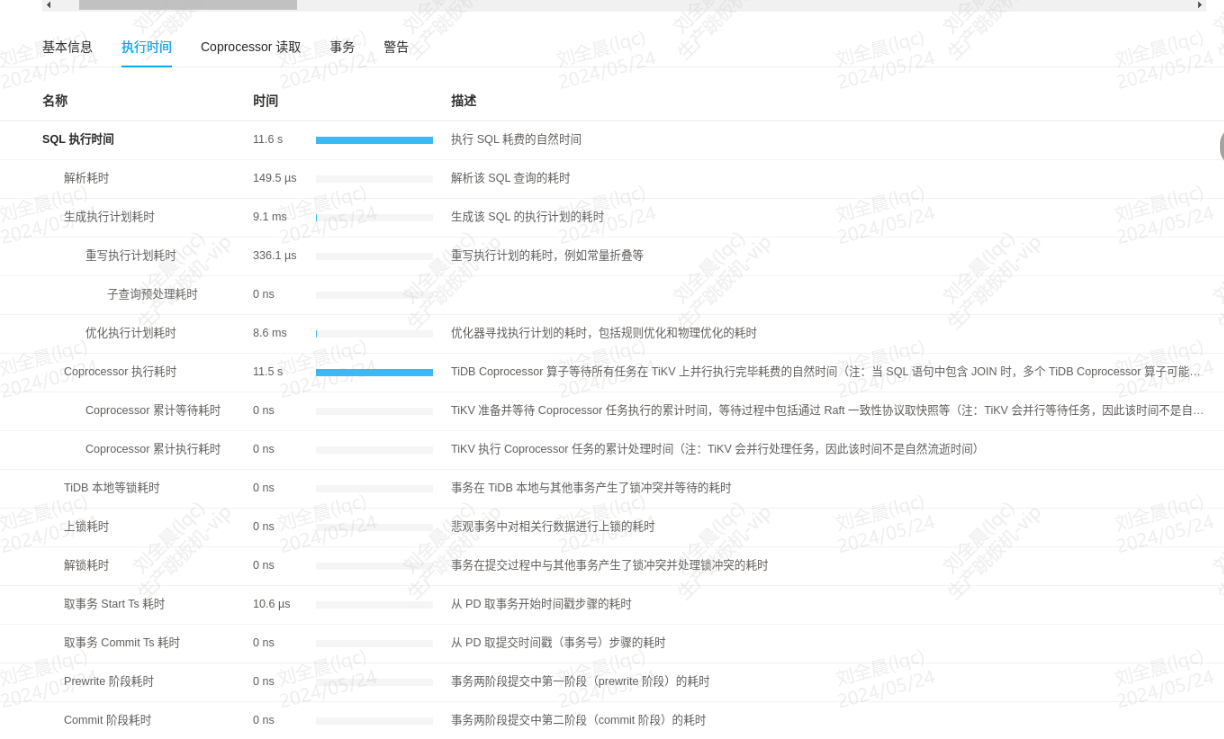
【遇到的问题:问题现象及影响】
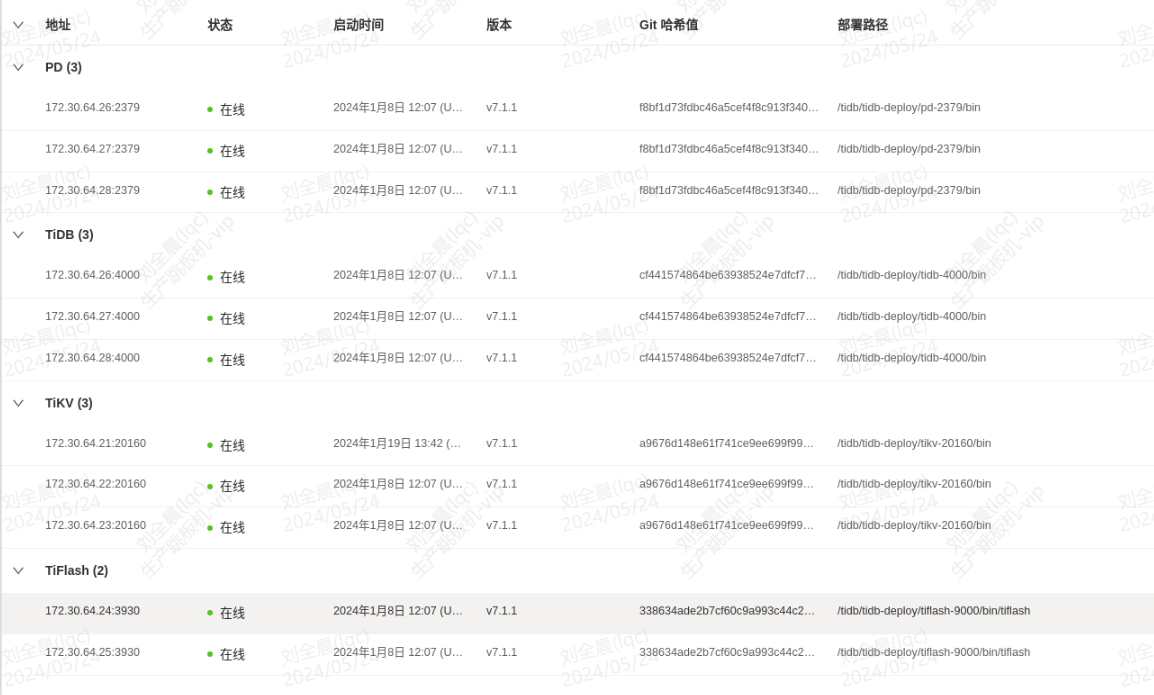
【资源配置】进入到 TiDB Dashboard -集群信息 (Cluster Info) -主机(Hosts) 截图此页面
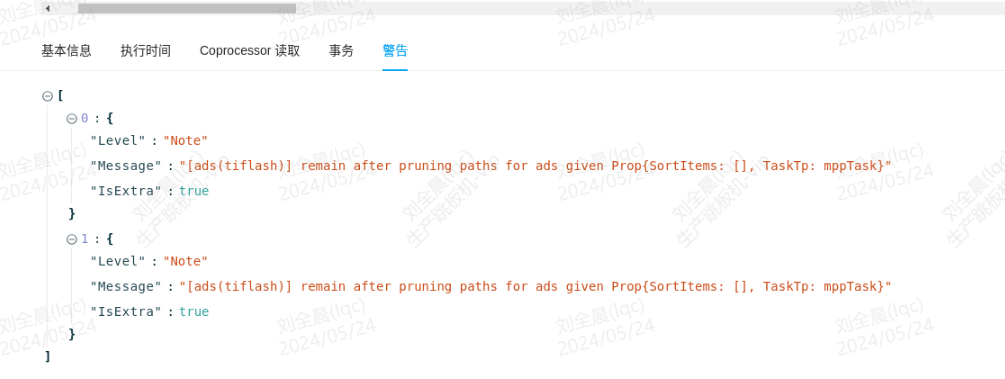
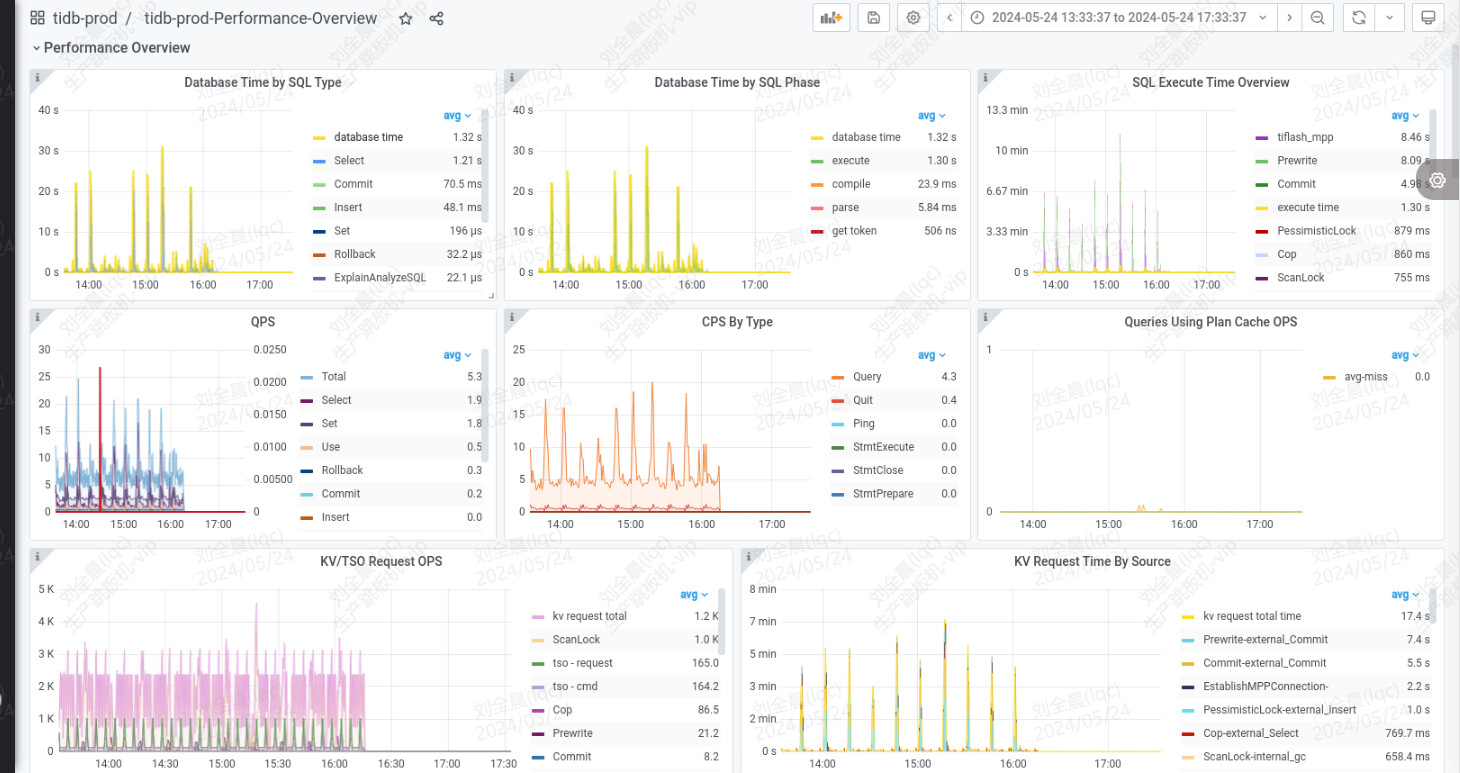
【附件:截图/日志/监控】


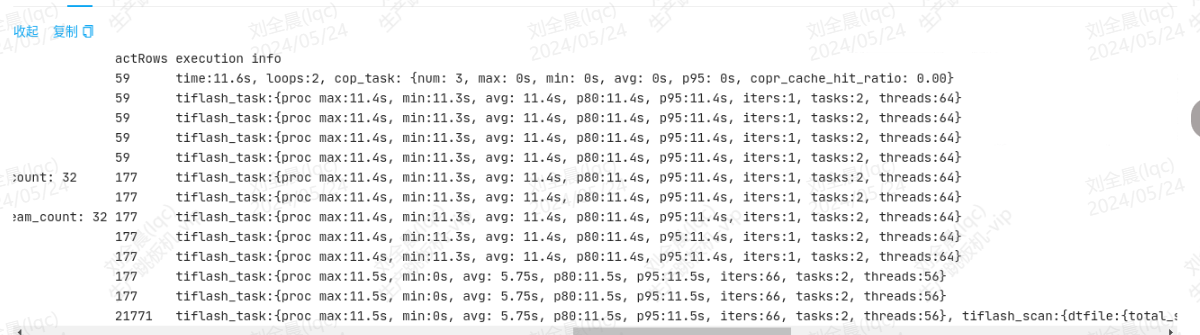
| A | id | task | estRows | operator info | actRows | execution info | memory | disk |
|---|---|---|---|---|---|---|---|---|
| TableReader_68 | root | 1 | MppVersion: 1, data:ExchangeSender_67 | 61 | time:28.9s, loops:2, cop_task: {num: 3, max: 0s, min: 0s, avg: 0s, p95: 0s, copr_cache_hit_ratio: 0.00} | 4.76 KB | N/A | |
| └─ExchangeSender_67 | cop[tiflash] | 1 | ExchangeType: PassThrough | 61 | tiflash_task:{proc max:28s, min:28s, avg: 28s, p80:28s, p95:28s, iters:1, tasks:2, threads:64} | N/A | N/A | |
| └─Projection_12 | cop[tiflash] | 1 | round(Column#10, 2)->Column#11, substring(cast(energy.ads_iot_current_value_minute.data_time, var_string(19)), 1, 16)->Column#12, energy.ads_iot_current_value_minute.measure_tag | 61 | tiflash_task:{proc max:28s, min:28s, avg: 28s, p80:28s, p95:28s, iters:1, tasks:2, threads:64} | N/A | N/A | |
| └─Projection_62 | cop[tiflash] | 1 | Column#10, energy.ads_iot_current_value_minute.measure_tag, energy.ads_iot_current_value_minute.data_time | 61 | tiflash_task:{proc max:28s, min:28s, avg: 28s, p80:28s, p95:28s, iters:1, tasks:2, threads:64} | N/A | N/A | |
| └─HashAgg_60 | cop[tiflash] | 1 | group by:Column#30, Column#31, funcs:sum(Column#27)->Column#10, funcs:firstrow(Column#28)->energy.ads_iot_current_value_minute.measure_tag, funcs:firstrow(Column#29)->energy.ads_iot_current_value_minute.data_time, stream_count: 32 | 61 | tiflash_task:{proc max:28s, min:28s, avg: 28s, p80:28s, p95:28s, iters:1, tasks:2, threads:64} | N/A | N/A | |
| └─Projection_69 | cop[tiflash] | 17.90 | energy.ads_iot_current_value_minute.data_value, energy.ads_iot_current_value_minute.measure_tag, energy.ads_iot_current_value_minute.data_time, substring(cast(energy.ads_iot_current_value_minute.data_time, var_string(19)), 1, 16)->Column#30, energy.ads_iot_current_value_minute.measure_tag, stream_count: 32 | 61 | tiflash_task:{proc max:28s, min:28s, avg: 28s, p80:28s, p95:28s, iters:1, tasks:2, threads:64} | N/A | N/A | |
| └─Selection_37 | cop[tiflash] | 17.90 | eq(Column#9, 1), stream_count: 32 | 61 | tiflash_task:{proc max:28s, min:28s, avg: 28s, p80:28s, p95:28s, iters:1, tasks:2, threads:64} | N/A | N/A | |
| └─Window_39 | cop[tiflash] | 22.38 | row_number()->Column#9 over(partition by energy.ads_iot_current_value_minute.measure_point_id, energy.ads_iot_current_value_minute.measure_tag, energy.ads_iot_current_value_minute.data_time order by energy.ads_iot_current_value_minute.create_time desc rows between current row and current row), stream_count: 32 | 61 | tiflash_task:{proc max:28s, min:28s, avg: 28s, p80:28s, p95:28s, iters:1, tasks:2, threads:64} | N/A | N/A | |
| └─Sort_44 | cop[tiflash] | 22.38 | energy.ads_iot_current_value_minute.measure_point_id, energy.ads_iot_current_value_minute.measure_tag, energy.ads_iot_current_value_minute.data_time, energy.ads_iot_current_value_minute.create_time:desc, stream_count: 32 | 61 | tiflash_task:{proc max:28s, min:28s, avg: 28s, p80:28s, p95:28s, iters:1, tasks:2, threads:64} | N/A | N/A | |
| └─ExchangeReceiver_43 | cop[tiflash] | 22.38 | stream_count: 32 | 61 | tiflash_task:{proc max:28s, min:28s, avg: 28s, p80:28s, p95:28s, iters:1, tasks:2, threads:64} | N/A | N/A | |
| └─ExchangeSender_42 | cop[tiflash] | 22.38 | ExchangeType: HashPartition, Compression: FAST, Hash Cols: [name: energy.ads_iot_current_value_minute.measure_tag, collate: utf8mb4_bin], stream_count: 32 | 61 | tiflash_task:{proc max:28.7s, min:0s, avg: 14.4s, p80:28.7s, p95:28.7s, iters:61, tasks:2, threads:77} | N/A | N/A | |
| └─Selection_41 | cop[tiflash] | 22.38 | eq(energy.ads_iot_current_value_minute.measure_tag, GEN.P), ge(energy.ads_iot_current_value_minute.data_time, 2024-05-24 00:00:00.000000), ge(energy.ads_iot_current_value_minute.data_value, 0), le(energy.ads_iot_current_value_minute.data_time, 2024-05-24 23:59:59.000000) | 61 | tiflash_task:{proc max:28.7s, min:0s, avg: 14.4s, p80:28.7s, p95:28.7s, iters:61, tasks:2, threads:77} | N/A | N/A | |
| └─TableFullScan_40 | cop[tiflash] | 989009.75 | table:ads, pushed down filter:eq(energy.ads_iot_current_value_minute.measure_point_id, be06c45012f711ed9eb91c8cf913d9a6), keep order:false, PartitionTableScan:true | 3233 | tiflash_task:{proc max:28.7s, min:0s, avg: 14.4s, p80:28.7s, p95:28.7s, iters:61, tasks:2, threads:77}, tiflash_scan:{dtfile:{total_scanned_packs:3490, total_skipped_packs:10830, total_scanned_rows:28492955, total_skipped_rows:88357511, total_rs_index_load_time: 0ms, total_read_time: 1373ms}, total_create_snapshot_time: 0ms, total_local_region_num: 0, total_remote_region_num: 44} | N/A | N/A |