【 TiDB 使用环境】生产环境
tiflash版本7.5.1
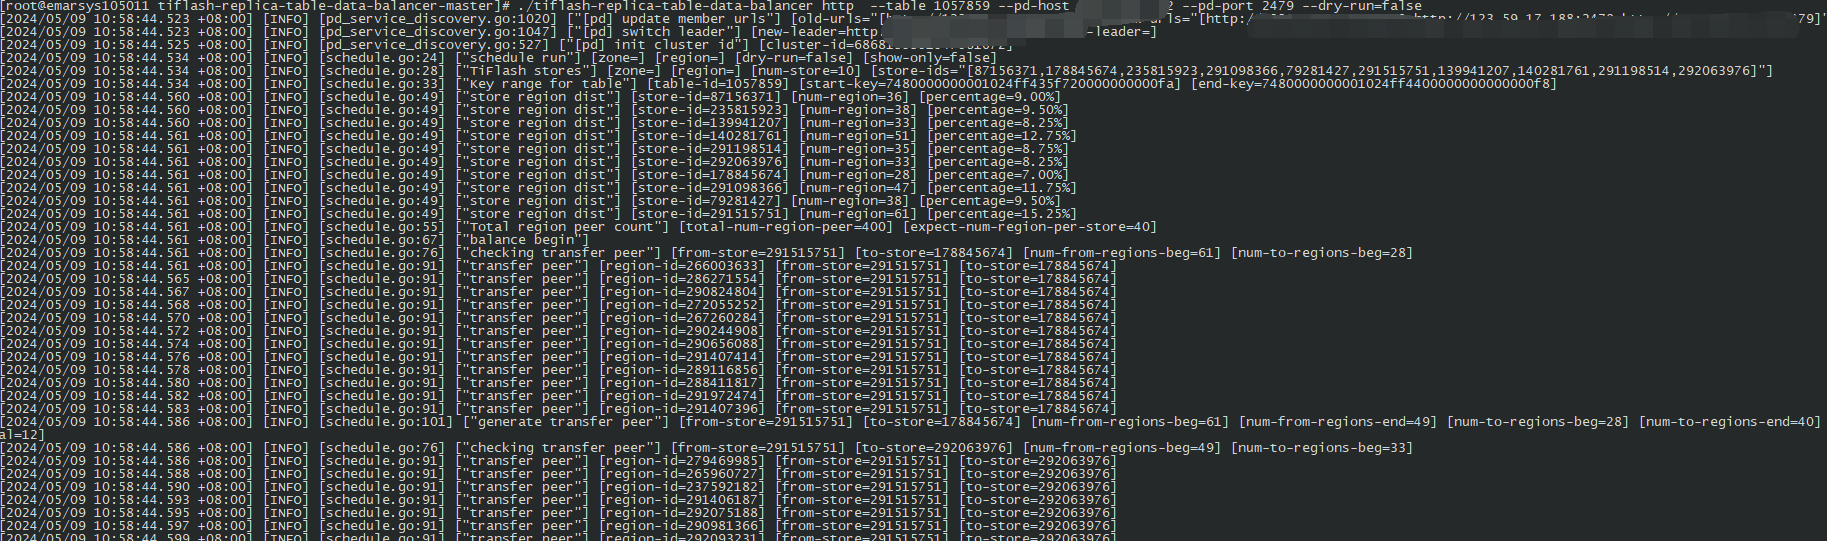
权重一致,10个tiflash。结果总是绿色的64 cpu异常高,有没有参数或者配置让tiflash压力更加均衡
【附件:截图/日志/监控】
【 TiDB 使用环境】生产环境
tiflash版本7.5.1
权重一致,10个tiflash。结果总是绿色的64 cpu异常高,有没有参数或者配置让tiflash压力更加均衡
【附件:截图/日志/监控】
机器配置都是一致的嘛
配置一致
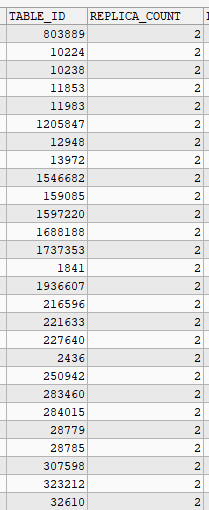
副本数都是 2 么?
SELECT * FROM information_schema.tiflash_replica;
Tiflash – Task Scheduler – Active and Waiting Queries Count 看一下 task 是否均衡?
有啥特殊业务?
https://docs.pingcap.com/zh/tidb/stable/top-sql
要分析这种单台比较出挑的情况,推荐使用topsql界面看看这台执行的sql是那些。
还有就是,tidb的ddl只有一台owner负责执行,有可能是这个原因。
topsql 只分析tidb和tikv,现在cpu分布不均的是tiflash,和tidb ddl 有什么关系?
ok,是我没注意审题。
我仔细想了想,tiflash的话好像还真没有想到特别好的办法。看看其他大佬怎么说。
select TABLE_ID, p.STORE_ID, ADDRESS, count(p.REGION_ID)
from information_schema.tikv_region_status r, information_schema.tikv_region_peers p, information_schema.tikv_store_status s
where r.db_name = 'db_x' and r.table_name = 't_x'
and r.region_id = p.region_id and p.store_id = s.store_id and json_extract(s.label, "$[0].value") = "tiflash"
group by TABLE_ID, p.STORE_ID, ADDRESS;
如果是单机多实例,location-label 要设置成 “host”。
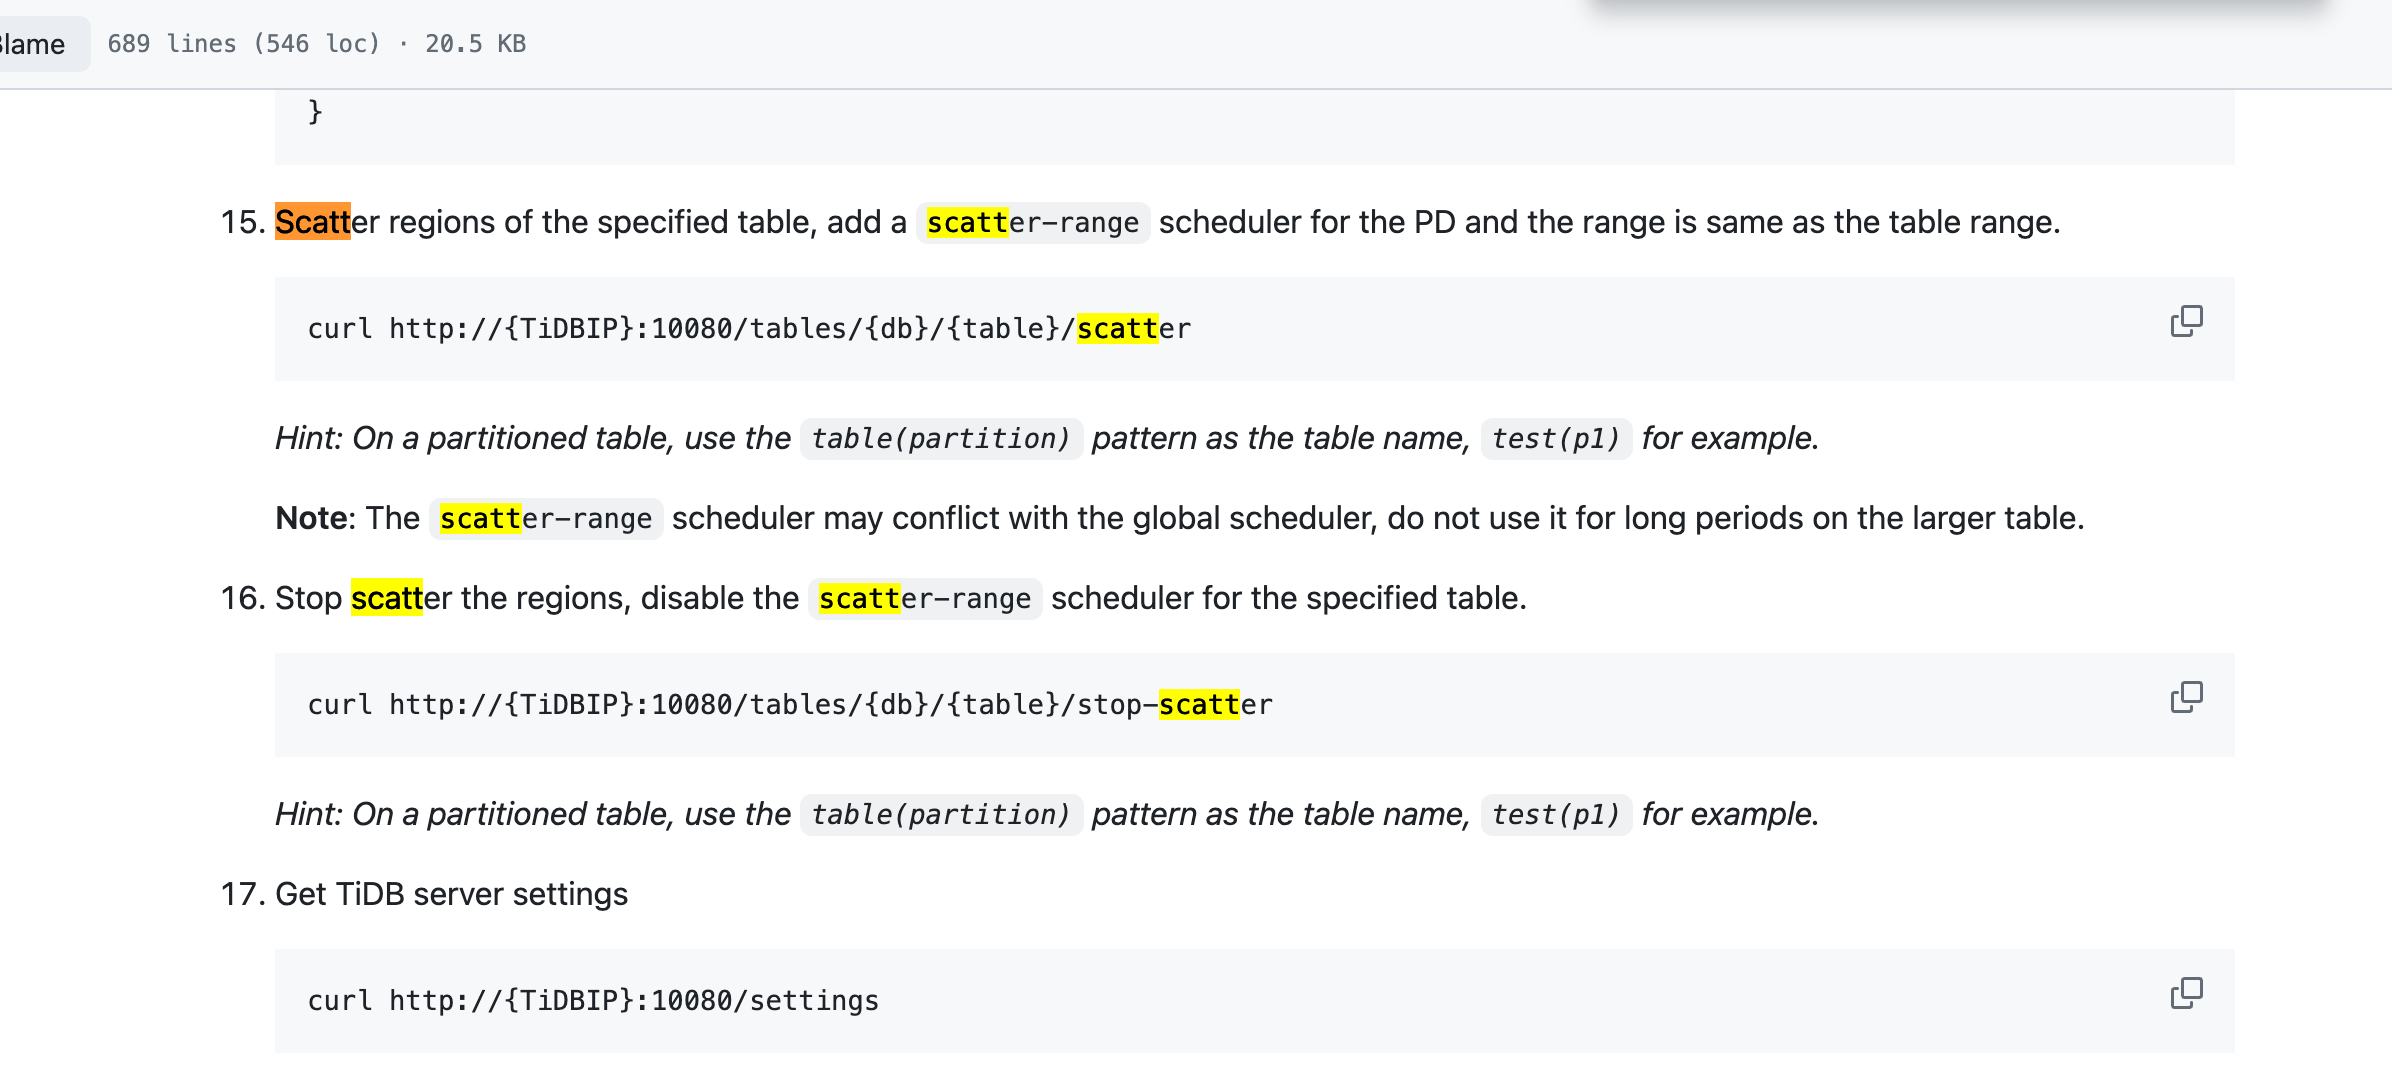
如果是单机单实例,可以用 GitHub - Lloyd-Pottiger/tiflash-replica-table-data-balancer: A tool helps to balance the table data of TiFlash replicas between multiple TiFlash instances 这种工具手动调度 TiFlash 副本的 region 分布。
随便找个慢查询的表,确实分布不均衡。tiflash的region 不是平均分布吗
大佬厉害,等我编译个跑跑看
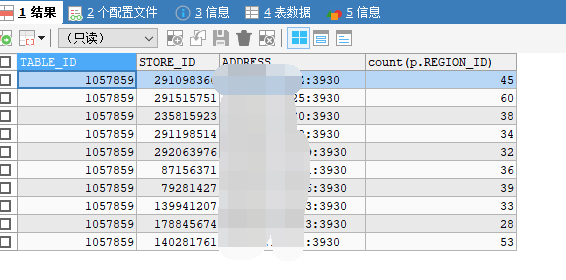
tiflash 的 region 只会在 store 级别均衡,也就是每个 store 的 region 总数平均。但每个 table 在各个 store 的 region 数量不一定平均。
出现这种情况要怎么处理呢?
我理解你这个不影响使用。
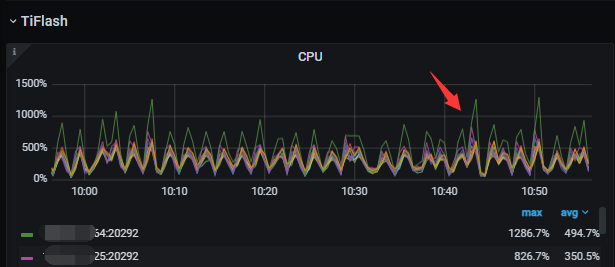
你可以试试用这个接口 scatter 表 region,不过对 tiflash 有没有用 我不确定:tidb/docs/tidb_http_api.md at master · pingcap/tidb · GitHub
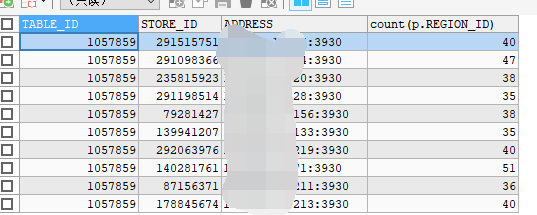
编译后跑了一下,region分布确实均衡一些,可能分布的算法还需要调整?膜拜大佬了
调度前
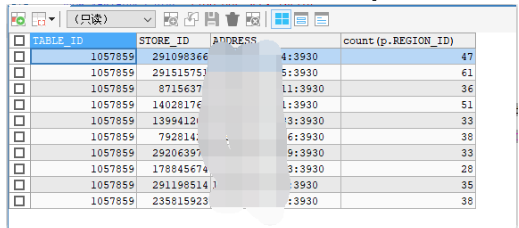
调度后
先用这个方式解决tiflash 的热点region, 期待后面tiflash 有UI层面的热点图和官方参数来调整
需要对业务场景进行分享,查看一下底层日志。
此话题已在最后回复的 60 天后被自动关闭。不再允许新回复。