【 TiDB 使用环境】生产环境 /测试/ Poc
【 TiDB 版本】
【复现路径】做过哪些操作出现的问题
【遇到的问题:问题现象及影响】
【资源配置】进入到 TiDB Dashboard -集群信息 (Cluster Info) -主机(Hosts) 截图此页面
【附件:截图/日志/监控】
tidb 5.0升级到tidb7.1.4 表结构索引完全一致
执行计划不一致
5.0的执行计划
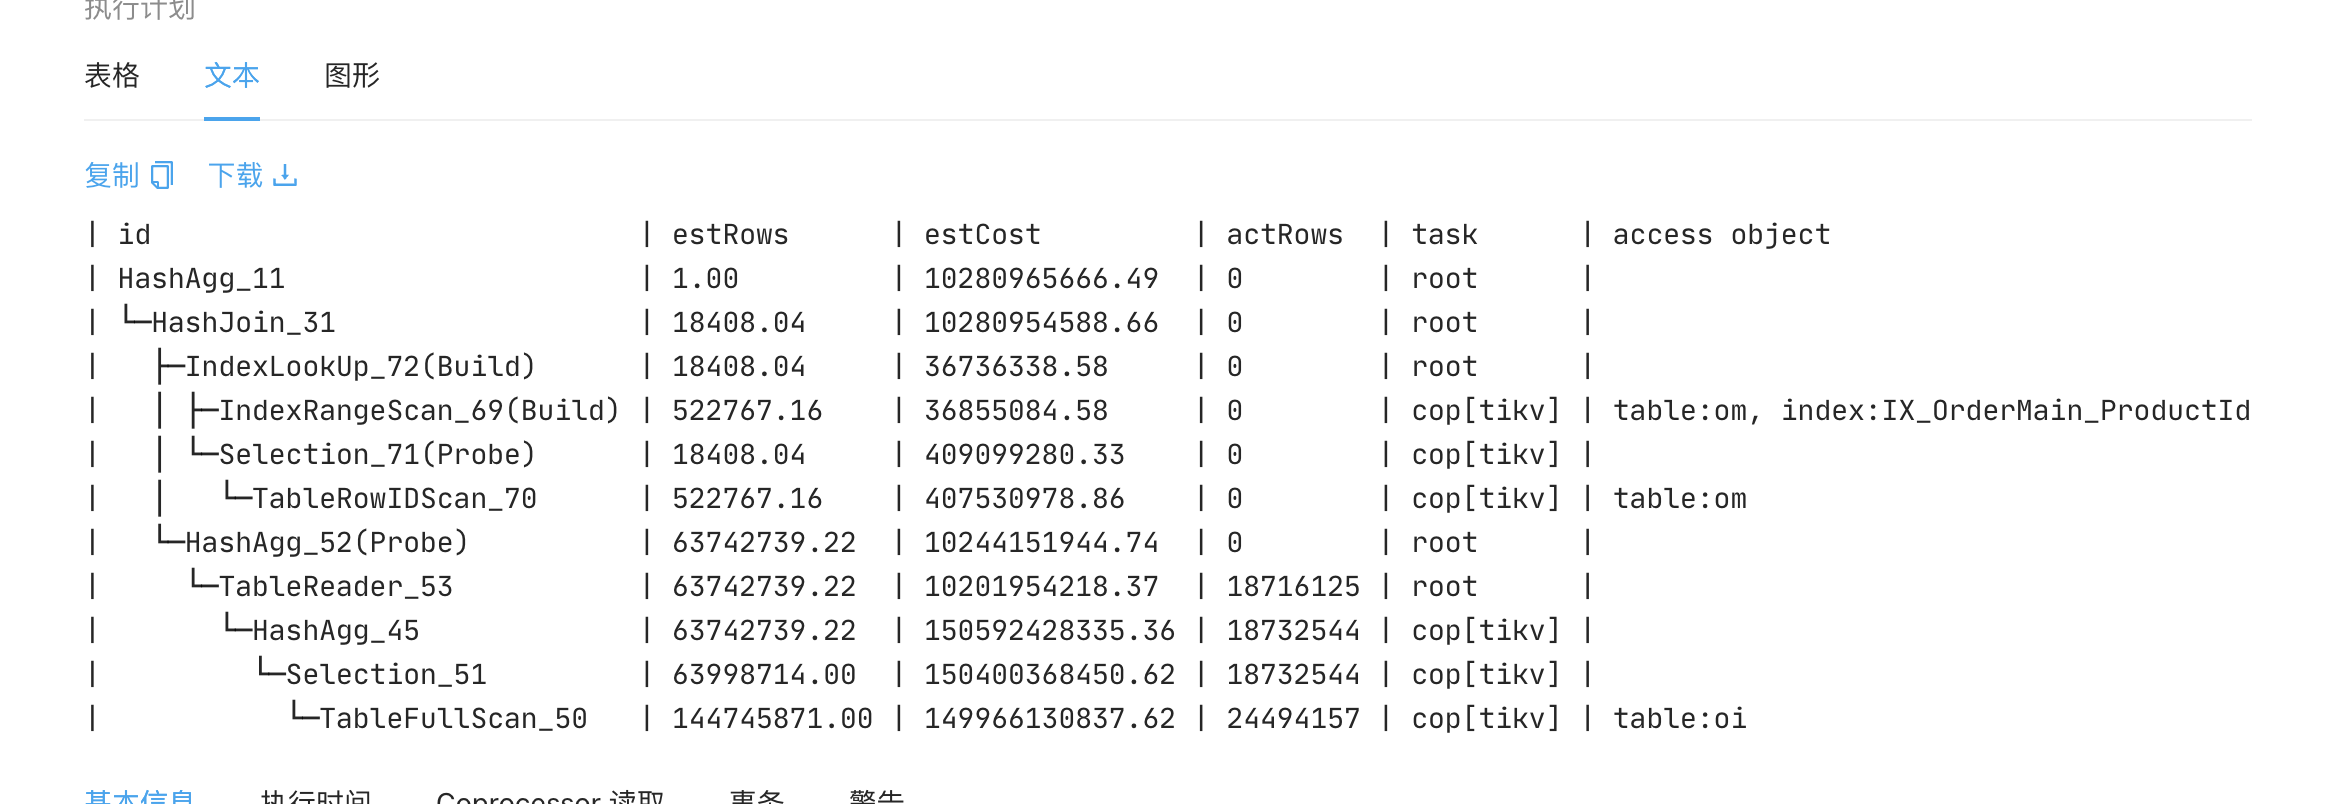
7.1.4执行计划
【 TiDB 使用环境】生产环境 /测试/ Poc
【 TiDB 版本】
【复现路径】做过哪些操作出现的问题
【遇到的问题:问题现象及影响】
【资源配置】进入到 TiDB Dashboard -集群信息 (Cluster Info) -主机(Hosts) 截图此页面
【附件:截图/日志/监控】
tidb 5.0升级到tidb7.1.4 表结构索引完全一致
执行计划不一致
5.0的执行计划
7.1.4执行计划
7.1.4
| id | estRows | estCost | actRows | task | access object | execution info | operator info | memory | disk |
| HashAgg_11 | 1.00 | 10280965666.49 | 0 | root | | time:43.8s, loops:1, partial_worker:{wall_time:43.799338611s, concurrency:5, task_num:0, tot_wait:3m38.996347675s, tot_exec:0s, tot_time:3m38.9963561s, max:43.79928055s, p95:43.79928055s}, final_worker:{wall_time:43.7993285s, concurrency:5, task_num:0, tot_wait:3m38.996360559s, tot_exec:3.656µs, tot_time:3m38.996367341s, max:43.799277404s, p95:43.799277404s} | funcs:count(Column#119)->Column#118 | 9.86 KB | N/A |
| └─HashJoin_31 | 18408.04 | 10280954588.66 | 0 | root | | time:43.8s, loops:1, build_hash_table:{total:1.15ms, fetch:1.15ms, build:0s} | inner join, equal:[eq(tcscenerymemberorderall.ordermain.serialid, tcscenerymemberorderall.orderitem.serialid)] | 0 Bytes | 0 Bytes |
| ├─IndexLookUp_72(Build) | 18408.04 | 36736338.58 | 0 | root | | time:1.1ms, loops:1 | | 247 Bytes | N/A |
| │ ├─IndexRangeScan_69(Build) | 522767.16 | 36855084.58 | 0 | cop[tikv] | table:om, index:IX_OrderMain_ProductId_TravelBeginDate(ProductId, TravelBeginDate) | time:626.9µs, loops:1, cop_task: {num: 1, max: 571.3µs, proc_keys: 0, tot_proc: 235.2µs, tot_wait: 28.6µs, rpc_num: 1, rpc_time: 555.3µs, copr_cache_hit_ratio: 0.00, build_task_duration: 395.5µs, max_distsql_concurrency: 1}, tikv_task:{time:0s, loops:1}, scan_detail: {total_keys: 1, get_snapshot_time: 13.5µs, rocksdb: {block: {cache_hit_count: 8, read_count: 2, read_byte: 33.5 KB, read_time: 19.8µs}}} | range:[622408 2022-08-18 00:00:00,622408 +inf], keep order:false, stats:partial[productid:allEvicted, travelbegindate:allEvicted, travelenddate:allEvicted…(more: 2 allEvicted)] | N/A | N/A |
| │ └─Selection_71(Probe) | 18408.04 | 409099280.33 | 0 | cop[tikv] | | | eq(tcscenerymemberorderall.ordermain.isvalid, 1), eq(tcscenerymemberorderall.ordermain.orderflag, 3), eq(tcscenerymemberorderall.ordermain.paystate, 2), eq(tcscenerymemberorderall.ordermain.projectid, 0), ge(tcscenerymemberorderall.ordermain.travelenddate, 2024-04-23 00:00:00.000000) | N/A | N/A |
| │ └─TableRowIDScan_70 | 522767.16 | 407530978.86 | 0 | cop[tikv] | table:om | | keep order:false, stats:partial[productid:allEvicted, travelbegindate:allEvicted, travelenddate:allEvicted…(more: 2 allEvicted)] | N/A | N/A |
| └─HashAgg_52(Probe) | 63742739.22 | 10244151944.74 | 0 | root | | time:43.8s, loops:1, partial_worker:{wall_time:2m50.574981702s, concurrency:5, task_num:1448, tot_wait:1.12841117s, tot_exec:3m30.402290003s, tot_time:12m14.773561903s, max:2m50.574142459s, p95:2m50.574142459s}, final_worker:{wall_time:43.799263497s, concurrency:5, task_num:0, tot_wait:3m38.996087861s, tot_exec:1.062µs, tot_time:3m38.996090648s, max:43.799232589s, p95:43.799232589s} | group by:tcscenerymemberorderall.orderitem.serialid, funcs:count(Column#130)->Column#119, funcs:firstrow(tcscenerymemberorderall.orderitem.serialid)->tcscenerymemberorderall.orderitem.serialid | 4.30 GB | N/A |
| └─TableReader_53 | 63742739.22 | 10201954218.37 | 18716125 | root | | time:1s, loops:1458, cop_task: {num: 1948, max: 0s, min: 0s, avg: 67.8ms, p95: 222.5ms, tot_proc: 51.9s, tot_wait: 169.7ms, rpc_num: 1949, rpc_time: 2m12s, copr_cache_hit_ratio: 0.00, build_task_duration: 454.5ms, max_distsql_concurrency: 15}, backoff{regionMiss: 2ms} | data:HashAgg_45 | 20.7 MB | N/A |
| └─HashAgg_45 | 63742739.22 | 150592428335.36 | 18732544 | cop[tikv] | | tikv_task:{proc max:279ms, min:0s, avg: 26.1ms, p80:46ms, p95:109ms, iters:24023, tasks:1948}, scan_detail: {total_process_keys: 24494157, total_process_keys_size: 14239261237, total_keys: 24520244, get_snapshot_time: 48.9ms, rocksdb: {delete_skipped_count: 13268, key_skipped_count: 50261573, block: {cache_hit_count: 499917, read_count: 12969, read_byte: 101.9 MB, read_time: 264.7ms}}} | group by:tcscenerymemberorderall.orderitem.serialid, funcs:count(1)->Column#130 | N/A | N/A |
| └─Selection_51 | 63998714.00 | 150400368450.62 | 18732544 | cop[tikv] | | tikv_task:{proc max:247ms, min:0s, avg: 21.3ms, p80:38ms, p95:86.1ms, iters:24023, tasks:1948} | eq(tcscenerymemberorderall.orderitem.resourcetype, 1), ne(tcscenerymemberorderall.orderitem.contractamount, 0), ne(tcscenerymemberorderall.orderitem.saleamount, 0) | N/A | N/A |
| └─TableFullScan_50 | 144745871.00 | 149966130837.62 | 24494157 | cop[tikv] | table:oi | tikv_task:{proc max:233ms, min:0s, avg: 18.5ms, p80:33ms, p95:75.1ms, iters:24023, tasks:1948} | keep order:false, stats:partial[ID 71:allEvicted, ID 73:allEvicted] | N/A | N/A |
5.0.4
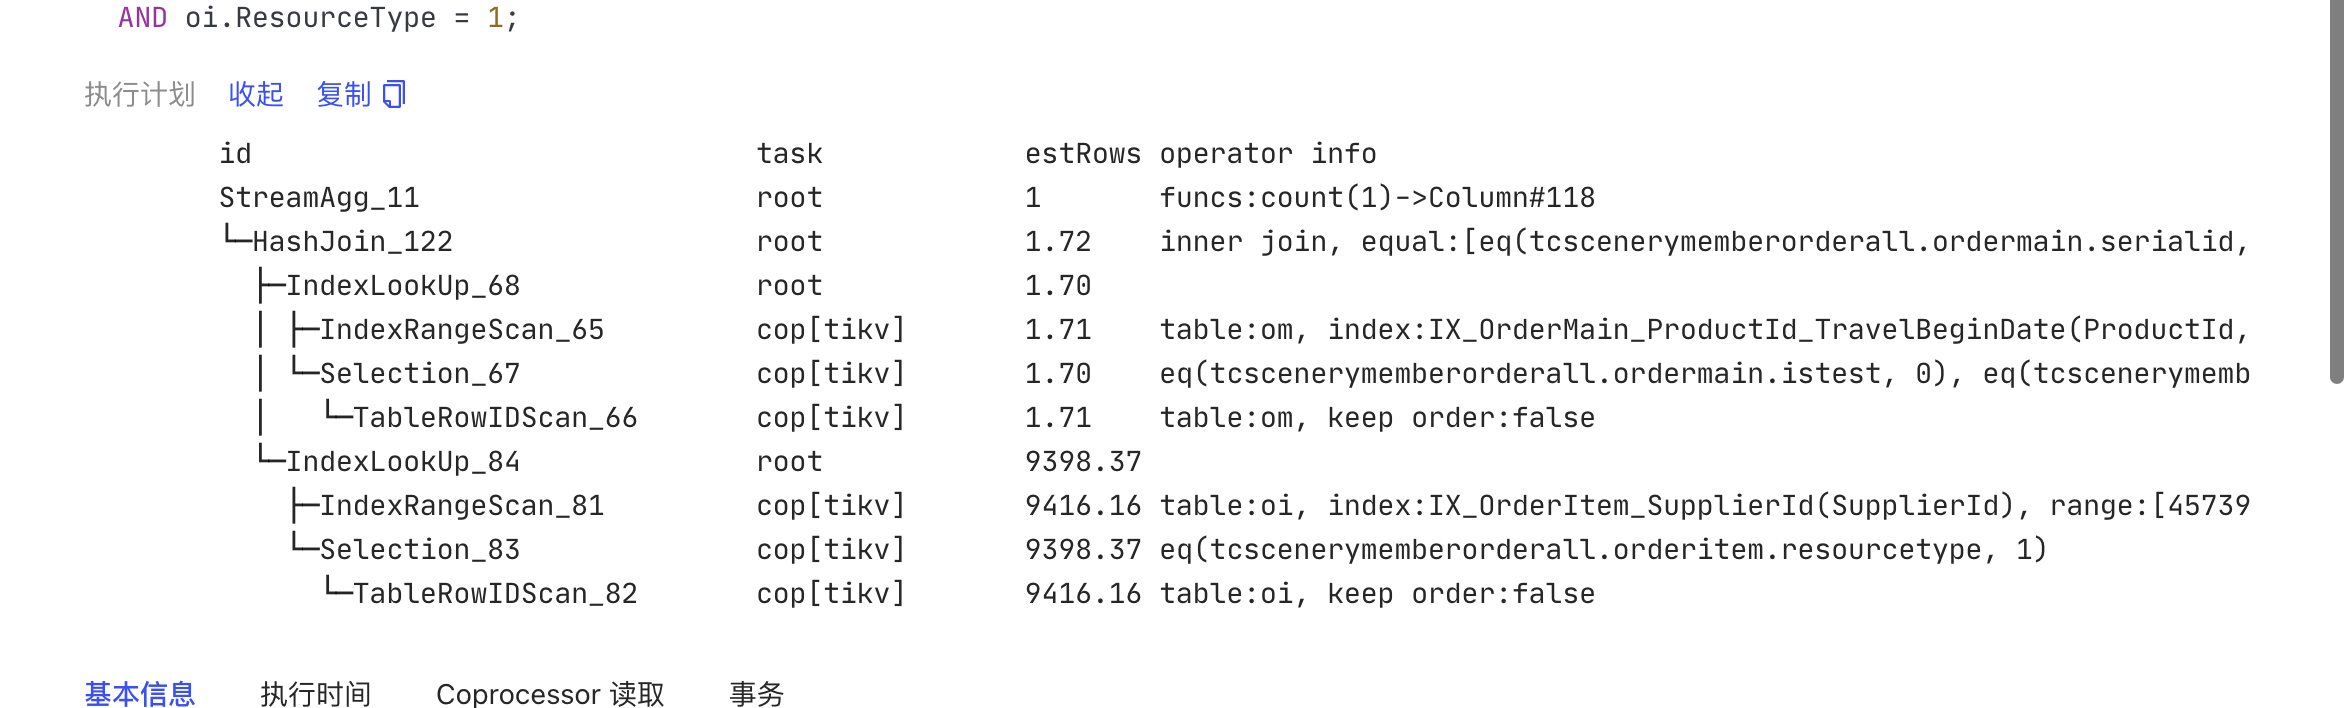
| id | task | estRows | operator info | actRows | execution info | memory | disk | |
|---|---|---|---|---|---|---|---|---|
| StreamAgg_11 | root | 1 | funcs:count(1)->Column#118 | 1 | time:435.7ms, loops:2 | 8 Bytes | N/A | |
| └─HashJoin_122 | root | 1.72 | inner join, equal:[eq(tcscenerymemberorderall.ordermain.serialid, tcscenerymemberorderall.orderitem.serialid)] | 23380 | time:434.9ms, loops:28, build_hash_table:{total:74ms, fetch:64.3ms, build:9.66ms}, probe:{concurrency:5, total:2.18s, max:435.6ms, probe:95.8ms, fetch:2.08s} | 1.83 MB | 0 Bytes | |
| ├─IndexLookUp_68 | root | 1.70 | 23549 | time:68.8ms, loops:24, index_task: {total_time: 2.17ms, fetch_handle: 2.14ms, build: 2.81µs, wait: 31.3µs}, table_task: {total_time: 255.1ms, num: 5, concurrency: 5} | 1.92 MB | N/A | ||
| │ ├─IndexRangeScan_65 | cop[tikv] | 1.71 | table:om, index:IX_OrderMain_ProductId_TravelBeginDate(ProductId, TravelBeginDate), range:[32558 2024-04-02 00:00:00,32558 2024-04-24 00:00:00), keep order:false | 23601 | time:924.9µs, loops:26, cop_task: {num: 1, max: 499.2µs, proc_keys: 0, rpc_num: 1, rpc_time: 474.7µs, copr_cache_hit_ratio: 1.00}, tikv_task:{time:15ms, loops:28}, scan_detail: {total_process_keys: 0, total_keys: 0, rocksdb: {delete_skipped_count: 0, key_skipped_count: 0, block: {cache_hit_count: 0, read_count: 0, read_byte: 0 Bytes}}} | N/A | N/A | |
| │ └─Selection_67 | cop[tikv] | 1.70 | eq(tcscenerymemberorderall.ordermain.istest, 0), eq(tcscenerymemberorderall.ordermain.isvalid, 1), eq(tcscenerymemberorderall.ordermain.projectid, 0) | 23549 | time:217.3ms, loops:29, cop_task: {num: 62, max: 57.2ms, min: 543.6µs, avg: 12.7ms, p95: 47.7ms, max_proc_keys: 1848, p95_proc_keys: 1352, tot_proc: 653ms, rpc_num: 62, rpc_time: 784.6ms, copr_cache_hit_ratio: 0.10}, tikv_task:{proc max:54ms, min:0s, p80:20ms, p95:45ms, iters:202, tasks:62}, scan_detail: {total_process_keys: 20883, total_keys: 21723, rocksdb: {delete_skipped_count: 106, key_skipped_count: 2814, block: {cache_hit_count: 243947, read_count: 7, read_byte: 161.0 KB}}} | N/A | N/A | |
| │ └─TableRowIDScan_66 | cop[tikv] | 1.71 | table:om, keep order:false | 23601 | tikv_task:{proc max:54ms, min:0s, p80:20ms, p95:45ms, iters:202, tasks:62}, scan_detail: {total_process_keys: 0, total_keys: 0, rocksdb: {delete_skipped_count: 0, key_skipped_count: 0, block: {cache_hit_count: 0, read_count: 0, read_byte: 0 Bytes}}} | N/A | N/A | |
| └─IndexLookUp_84 | root | 9398.37 | 209625 | time:385.4ms, loops:206, index_task: {total_time: 305.8ms, fetch_handle: 20.1ms, build: 36.4µs, wait: 285.6ms}, table_task: {total_time: 1.86s, num: 14, concurrency: 5} | 7.43 MB | N/A | ||
| ├─IndexRangeScan_81 | cop[tikv] | 9416.16 | table:oi, index:IX_OrderItem_SupplierId(SupplierId), range:[45739,45739], keep order:false | 209625 | time:3.61ms, loops:207, cop_task: {num: 1, max: 512.4µs, proc_keys: 0, rpc_num: 1, rpc_time: 481.7µs, copr_cache_hit_ratio: 1.00}, tikv_task:{time:139ms, loops:209}, scan_detail: {total_process_keys: 0, total_keys: 0, rocksdb: {delete_skipped_count: 0, key_skipped_count: 0, block: {cache_hit_count: 0, read_count: 0, read_byte: 0 Bytes}}} | N/A | N/A | |
| └─Selection_83 | cop[tikv] | 9398.37 | eq(tcscenerymemberorderall.orderitem.resourcetype, 1) | 209625 | time:1.69s, loops:248, cop_task: {num: 71, max: 213.8ms, min: 791.6µs, avg: 80.6ms, p95: 180.7ms, max_proc_keys: 8460, p95_proc_keys: 7194, tot_proc: 5.34s, tot_wait: 2ms, rpc_num: 71, rpc_time: 5.72s, copr_cache_hit_ratio: 0.06}, tikv_task:{proc max:202ms, min:1ms, p80:110ms, p95:171ms, iters:511, tasks:71}, scan_detail: {total_process_keys: 207955, total_keys: 219300, rocksdb: {delete_skipped_count: 180, key_skipped_count: 37176, block: {cache_hit_count: 2360368, read_count: 65, read_byte: 1015.5 KB}}} | N/A | N/A | |
| └─TableRowIDScan_82 | cop[tikv] | 9416.16 | table:oi, keep order:false | 209625 | tikv_task:{proc max:202ms, min:1ms, p80:110ms, p95:170ms, iters:511, tasks:71}, scan_detail: {total_process_keys: 0, total_keys: 0, rocksdb: {delete_skipped_count: 0, key_skipped_count: 0, block: {cache_hit_count: 0, read_count: 0, read_byte: 0 Bytes}}} | N/A | N/A |
7.1.4 多了一个 group by
MySQL [TCSceneryMemberOrderAll]> explain select count(1) as refundCount from TCSceneryMemberOrderAll.RefundSupplier rs inner Join TCSceneryMemberOrderAll.OrderMain om ON om.SerialID=rs.SerialID inner Join TCSceneryMemberOrderAll.RefundOrder ro force index(IX_RefundOrder_RefundSerialId ) ON ro.RefundSerialId=rs.RefundSerialId where 1=1 and rs.CreateTime>=‘2024-03-01’ and rs.CreateTime<‘2024-04-24’ and rs.SupplierID=7387 and rs.RefundStatus=0 and rs.SerialID=‘sz178254326770384896087747’ and ro.PlatId <> 415 and ro.ProjectID=0 and rs.IsValid=1 and om.AgentID=1993;
±-----------------------------------------±------------±----------±------------------------------------------------------------------------------±---------------------------------------------------------------------------------------------------------------------------------------------------------------------------------------------------------------------------------------------------------------------------------------------------------------------+
| id | estRows | task | access object | operator info
|
±-----------------------------------------±------------±----------±------------------------------------------------------------------------------±---------------------------------------------------------------------------------------------------------------------------------------------------------------------------------------------------------------------------------------------------------------------------------------------------------------------+
| HashAgg_16 | 1.00 | root | | funcs:count(Column#127)->Column#126
|
| └─HashJoin_19 | 0.00 | root | | CARTESIAN inner join
|
| ├─HashJoin_36(Build) | 0.00 | root | | inner join, equal:[eq(tcscenerymemberorderall.refundsupplier.refundserialid, tcscenerymemberorderall.refundorder.refundserialid)]
|
| │ ├─IndexLookUp_74(Build) | 0.00 | root | |
|
| │ │ ├─IndexRangeScan_71(Build) | 1872.78 | cop[tikv] | table:rs, index:IX_RefundSupplier_RefundStatus_IsValid(RefundStatus, IsValid) | range:[0 1,0 1], keep order:false
|
| │ │ └─Selection_73(Probe) | 0.00 | cop[tikv] | | eq(tcscenerymemberorderall.refundsupplier.serialid, “sz178254326770384896087747”), eq(tcscenerymemberorderall.refundsupplier.supplierid, 7387), ge(tcscenerymemberorderall.refundsupplier.createtime, 2024-03-01 00:00:00.000000), lt(tcscenerymemberorderall.refundsupplier.createtime, 2024-04-24 00:00:00.000000) |
| │ │ └─TableRowIDScan_72 | 1872.78 | cop[tikv] | table:rs | keep order:false
|
| │ └─HashAgg_57(Probe) | 18276237.11 | root | | group by:tcscenerymemberorderall.refundorder.refundserialid, funcs:count(Column#136)->Column#127, funcs:firstrow(tcscenerymemberorderall.refundorder.refundserialid)->tcscenerymemberorderall.refundorder.refundserialid |
| │ └─IndexLookUp_58 | 18276237.11 | root | |
|
| │ ├─IndexFullScan_54(Build) | 18696096.00 | cop[tikv] | table:ro, index:IX_RefundOrder_RefundSerialId(RefundSerialId) | keep order:false |
| │ └─HashAgg_50(Probe) | 18276237.11 | cop[tikv] | | group by:tcscenerymemberorderall.refundorder.refundserialid, funcs:count(1)->Column#136 |
| │ └─Selection_56 | 18520869.18 | cop[tikv] | | eq(tcscenerymemberorderall.refundorder.projectid, 0), ne(tcscenerymemberorderall.refundorder.platid, 415) |
| │ └─TableRowIDScan_55 | 18696096.00 | cop[tikv] | table:ro | keep order:false |
| └─IndexLookUp_81(Probe) | 0.00 | root | | |
| ├─IndexRangeScan_78(Build) | 1.00 | cop[tikv] | table:om, index:IX_OrderMain_SerialID(SerialID) | range:[“sz178254326770384896087747”,“sz178254326770384896087747”], keep order:false |
| └─Selection_80(Probe) | 0.00 | cop[tikv] | | eq(tcscenerymemberorderall.ordermain.agentid, 1993) |
| └─TableRowIDScan_79 | 1.00 | cop[tikv] | table:om | keep order:false |
±-----------------------------------------±------------±----------±------------------------------------------------------------------------------±---------------------------------------------------------------------------------------------------------------------------------------------------------------------------------------------------------------------------------------------------------------------------------------------------------------------+
17 rows in set, 3 warnings (0.00 sec)
全索引扫描了
统计信息也一样吧
执行时间有区别吗?7版本对执行计划我记得在哪里版本更新的地方看到过说对执行计划有优化。
统计信息: replayer_8DQPE2X-wLe9I_HqfUHlDA==_1713851037740255330.zip|attachment (797.6 KB)
执行计划不一样.dat (16.5 KB)
新老版本执行计划不同的点。后面用 hint 解决的:
explain
SELECT
	/*+ LEADING(rs,om,ro) */
	count(1) AS refundCount
FROM
	TCSceneryMemberOrderAll.RefundSupplier rs
INNER JOIN
    TCSceneryMemberOrderAll.OrderMain om
ON
	om.SerialID = rs.SerialID
INNER JOIN
    TCSceneryMemberOrderAll.RefundOrder ro
ON
	ro.RefundSerialId = rs.RefundSerialId
WHERE
	1 = 1
	AND rs.CreateTime >= '2024-03-01'
	AND rs.CreateTime < '2024-04-24'
	AND rs.SupplierID = 39407
	AND rs.AssignOperatorJobNum = 'V20810'
	AND rs.RefundStatus = 0
	AND ro.PlatId <> 415
	AND ro.ProjectID = 0
	AND rs.IsValid = 1
	AND om.AgentID = 1993;
返回的时候 ±----------------------------------------------------------+
| File_token |
±----------------------------------------------------------+
| replayer_noKOnmKNqaSFeF7fqqV7-w==_1713854794051992499.zip |
±----------------------------------------------------------+
1 row in set, 1 warning (1.80 sec)
Warning (Code 1105): sync load stats timeout
会不会是索引合并功能没开启?
以前Oracle数据库升级也碰到过,调测了很久才解决
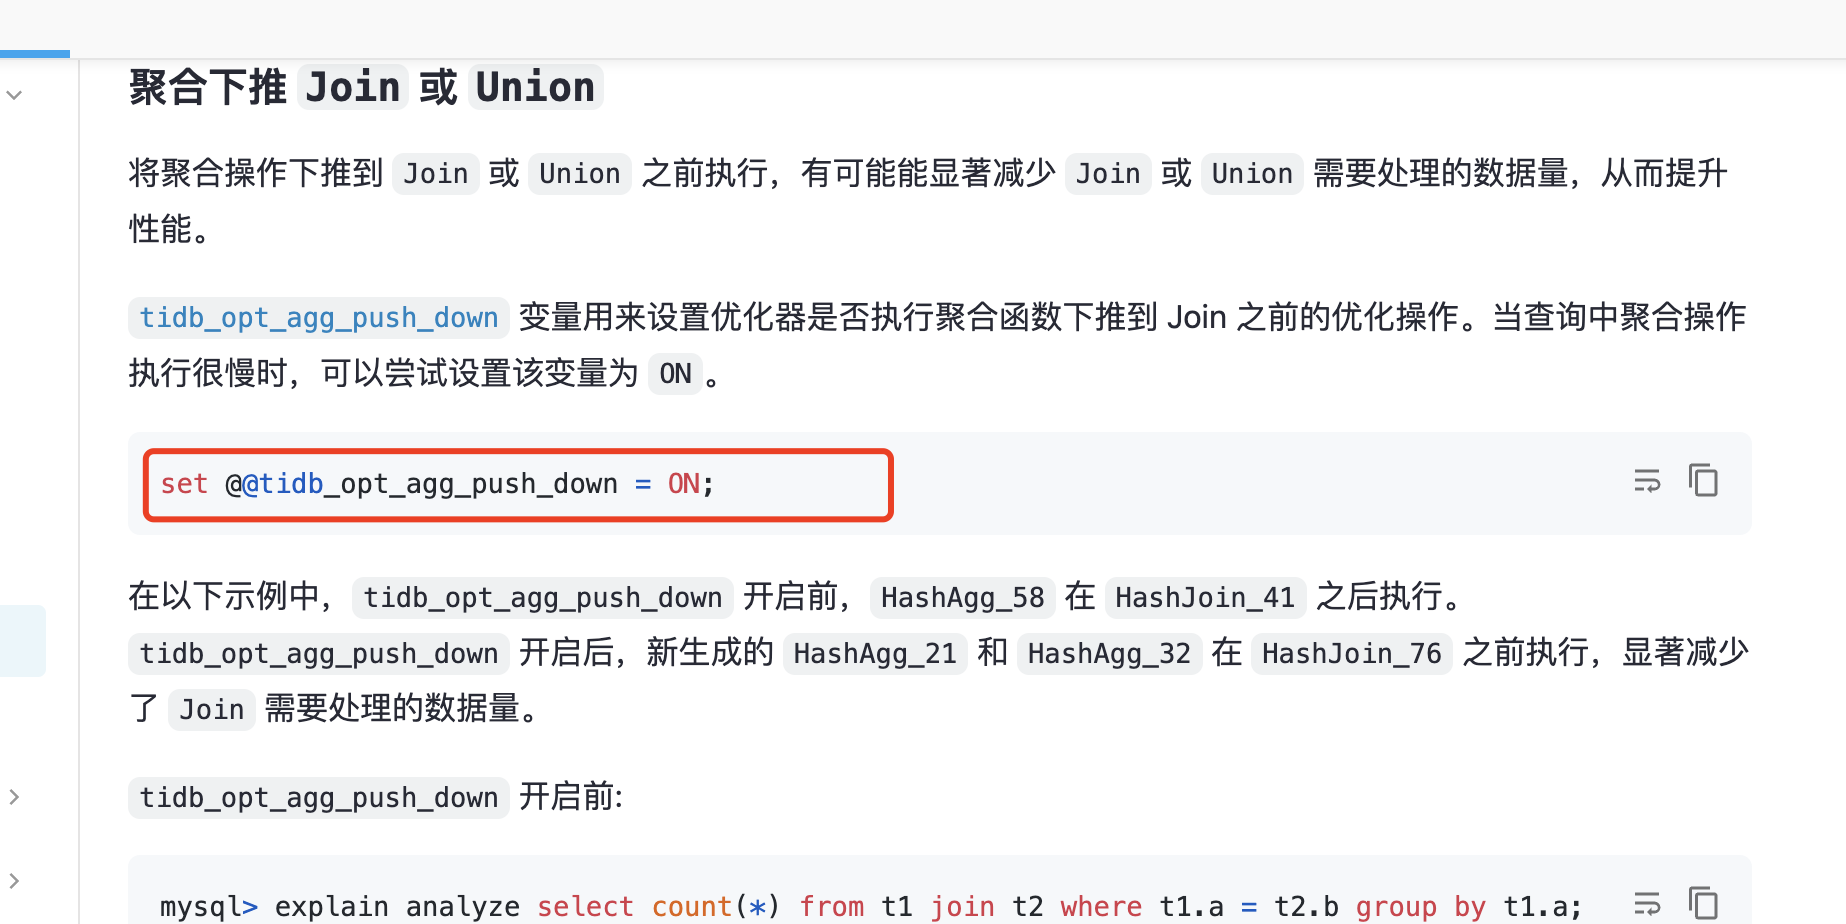
由于目前 TiDB 优化器的 CBO 能力还不够完善,类似这样的参数还不能默认打开。
这个变量对于 AP tiflash 来说大部分时间都是正收益,需要的时候可以考虑在确定打给 tiflash 的 query 连接上开启
升级到7.1之后,有没有对相关表做统计信息更新?
重新收集统计信息
此话题已在最后回复的 60 天后被自动关闭。不再允许新回复。