10.114.26.112 pd-2379.service, please check the instance’s log(/data13/tidb/deploy/pd-2379/log) for more detail.: timed out waiting for port 2379 to be started after 2m0s", “errorVerbose”: “timed out waiting for port 2379 to be started after 2m0s\ngithub.com/pingcap/tiup/pkg/cluster/module.(*WaitFor).Execute\n\tgithub.com/pingcap/tiup/pkg/cluster/module/wait_for.go:92\ngithub.com/pingcap/tiup/pkg/cluster/spec.PortStarted\n\tgithub.com/pingcap/tiup/pkg/cluster/spec/instance.go:129\ngithub.com/pingcap/tiup/pkg/cluster/spec.(*BaseInstance).Ready\n\tgithub.com/pingcap/tiup/pkg/cluster/spec/instance.go:167\ngithub.com/pingcap/tiup/pkg/cluster/operation.startInstance\n\tgithub.com/pingcap/tiup/pkg/cluster/operation/action.go:405\ngithub.com/pingcap/tiup/pkg/cluster/operation.StartComponent.func1\n\tgithub.com/pingcap/tiup/pkg/cluster/operation/action.go:534\ngolang.org/x/sync/errgroup.(*Group).Go.func1\n\tgolang.org/x/sync@v0.1.0/errgroup/errgroup.go:75\nruntime.goexit\n\truntime/asm_amd64.s:1650\nfailed to start: 10.114.26.112 pd-2379.service, please check the instance’s log(/data13/tidb/deploy/pd-2379/log) for more detail.\nfailed to start pd”}
2024-03-07T06:41:48.341+0800 INFO Execute command finished {“code”: 1, “error”: “failed to start pd: failed to start: 10.114.26.112 pd-2379.service, please check the instance’s log(/data13/tidb/deploy/pd-2379/log) for more detail.: timed out waiting for port 2379 to be started after 2m0s”, “errorVerbose”: “timed out waiting for port 2379 to be started after 2m0s\ngithub.com/pingcap/tiup/pkg/cluster/module.(*WaitFor).Execute\n\tgithub.com/pingcap/tiup/pkg/cluster/module/wait_for.go:92\ngithub.com/pingcap/tiup/pkg/cluster/spec.PortStarted\n\tgithub.com/pingcap/tiup/pkg/cluster/spec/instance.go:129\ngithub.com/pingcap/tiup/pkg/cluster/spec.(*BaseInstance).Ready\n\tgithub.com/pingcap/tiup/pkg/cluster/spec/instance.go:167\ngithub.com/pingcap/tiup/pkg/cluster/operation.startInstance\n\tgithub.com/pingcap/tiup/pkg/cluster/operation/action.go:405\ngithub.com/pingcap/tiup/pkg/cluster/operation.StartComponent.func1\n\tgithub.com/pingcap/tiup/pkg/cluster/operation/action.go:534\ngolang.org/x/sync/errgroup.(*Group).Go.func1\n\tgolang.org/x/sync@v0.1.0/errgroup/errgroup.go:75\nruntime.goexit\n\truntime/asm_amd64.s:1650\nfailed to start: 10.114.26.112 pd-2379.service, please check the instance’s log(/data13/tidb/deploy/pd-2379/log) for more detail.\nfailed to start pd”}
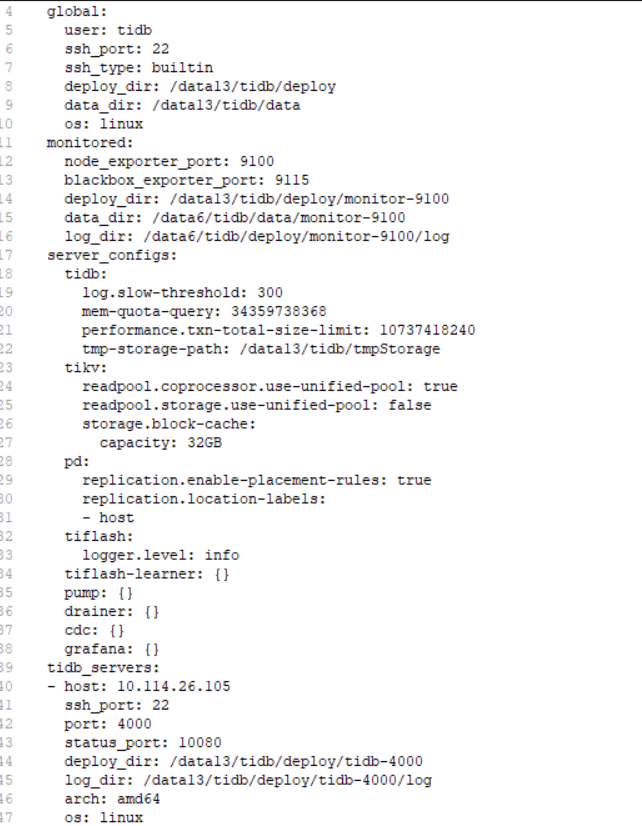
pd:
replication.enable-placement-rules: true
replication.location-labels:
- host
tiflash:
logger.level: info
tiflash-learner: {}
pump: {}
drainer: {}
cdc: {}
grafana: {}
tidb_servers:
- host: 10.114.26.105
ssh_port: 22
port: 4000
status_port: 10080
deploy_dir: /data13/tidb/deploy/tidb-4000
log_dir: /data13/tidb/deploy/tidb-4000/log
arch: amd64
os: linux - host: 10.114.26.112
ssh_port: 22
port: 4000
status_port: 10080
deploy_dir: /data13/tidb/deploy/tidb-4000
log_dir: /data13/tidb/deploy/tidb-4000/log
arch: amd64
os: linux - host: 10.114.26.113
ssh_port: 22
port: 4000
status_port: 10080
deploy_dir: /data13/tidb/deploy/tidb-4000
log_dir: /data13/tidb/deploy/tidb-4000/log
arch: amd64
os: linux
tikv_servers: - host: 10.114.26.102
ssh_port: 22
port: 20161
status_port: 20181
deploy_dir: /data13/tidb/deploy/tikv-20161
data_dir: /data11/tidb/data/tikv-20161
log_dir: /data11/tidb/deploy/tikv-20161/log
numa_node: “0”
config:
server.labels:
host: tikv102-1
arch: amd64
os: linux - host: 10.114.26.102
ssh_port: 22
port: 20162
status_port: 20182
deploy_dir: /data13/tidb/deploy/tikv-20162
data_dir: /data12/tidb/data/tikv-20162
log_dir: /data12/tidb/deploy/tikv-20162/log
numa_node: “0”
config:
server.labels:
host: tikv102-2
arch: amd64
os: linux - host: 10.114.26.102
ssh_port: 22
port: 20163
status_port: 20183
deploy_dir: /data13/tidb/deploy/tikv-20163
data_dir: /data13/tidb/data/tikv-20163
log_dir: /data13/tidb/deploy/tikv-20163/log
numa_node: “1”
config:
server.labels:
host: tikv102-3
arch: amd64
os: linux - host: 10.114.26.103
ssh_port: 22
port: 20161
status_port: 20181
deploy_dir: /data13/tidb/deploy/tikv-20161
data_dir: /data11/tidb/data/tikv-20161
log_dir: /data11/tidb/deploy/tikv-20161/log
numa_node: “0”
config:
server.labels:
host: tikv103-1
arch: amd64
os: linux - host: 10.114.26.103
ssh_port: 22
port: 20162
status_port: 20182
deploy_dir: /data13/tidb/deploy/tikv-20162
data_dir: /data12/tidb/data/tikv-20162
log_dir: /data12/tidb/deploy/tikv-20162/log
numa_node: “0”
config:
server.labels:
host: tikv103-2
arch: amd64
os: linux - host: 10.114.26.103
ssh_port: 22
port: 20163
status_port: 20183
deploy_dir: /data13/tidb/deploy/tikv-20163
data_dir: /data13/tidb/data/tikv-20163
log_dir: /data13/tidb/deploy/tikv-20163/log
numa_node: “1”
config:
server.labels:
host: tikv103-3
arch: amd64
os: linux - host: 10.114.26.104
ssh_port: 22
port: 20161
status_port: 20181
deploy_dir: /data13/tidb/deploy/tikv-20161
data_dir: /data11/tidb/data/tikv-20161
log_dir: /data11/tidb/deploy/tikv-20161/log
numa_node: “0”
config:
server.labels:
host: tikv104-1
arch: amd64
os: linux - host: 10.114.26.104
ssh_port: 22
port: 20162
status_port: 20182
deploy_dir: /data13/tidb/deploy/tikv-20162
data_dir: /data12/tidb/data/tikv-20162
log_dir: /data12/tidb/deploy/tikv-20162/log
numa_node: “0”
config:
server.labels:
host: tikv104-2
arch: amd64
os: linux - host: 10.114.26.104
ssh_port: 22
port: 20163
status_port: 20183
deploy_dir: /data13/tidb/deploy/tikv-20163
data_dir: /data13/tidb/data/tikv-20163
log_dir: /data13/tidb/deploy/tikv-20163/log
numa_node: “1”
config:
server.labels:
host: tikv104-3
arch: amd64
os: linux
tiflash_servers: - host: 10.114.26.102
ssh_port: 22
tcp_port: 8889
http_port: 8123
flash_service_port: 3930
flash_proxy_port: 20170
flash_proxy_status_port: 20292
metrics_port: 8234
deploy_dir: /data13/tidb/deploy/tiflash-8889
data_dir: /data6/tidb/data,/data7/tidb/data,/data8/tidb/data,/data9/tidb/data,/data10/tidb/data
log_dir: /data13/tidb/deploy/tiflash-8889/log
arch: amd64
os: linux - host: 10.114.26.105
ssh_port: 22
tcp_port: 8889
http_port: 8123
flash_service_port: 3930
flash_proxy_port: 20170
flash_proxy_status_port: 20292
metrics_port: 8234
deploy_dir: /data13/tidb/deploy/tiflash-8889
data_dir: /data8/tidb/data,/data9/tidb/data,/data10/tidb/data,/data11/tidb/data,/data12/tidb/data
log_dir: /data13/tidb/deploy/tiflash-8889/log
arch: amd64
os: linux
pd_servers: - host: 10.114.26.111
ssh_port: 22
name: pd-10.114.26.111-2379
client_port: 2379
peer_port: 2380
deploy_dir: /data13/tidb/deploy/pd-2379
data_dir: /data13/tidb/data/pd-2379
log_dir: /data13/tidb/deploy/pd-2379/log
arch: amd64
os: linux - host: 10.114.26.112
ssh_port: 22
name: pd-10.114.26.112-2379
client_port: 2379
peer_port: 2380
deploy_dir: /data13/tidb/deploy/pd-2379
data_dir: /data13/tidb/data/pd-2379
log_dir: /data13/tidb/deploy/pd-2379/log
arch: amd64
os: linux - host: 10.114.26.113
ssh_port: 22
name: pd-10.114.26.113-2379
client_port: 2379
peer_port: 2380
deploy_dir: /data13/tidb/deploy/pd-2379
data_dir: /data13/tidb/data/pd-2379
log_dir: /data13/tidb/deploy/pd-2379/log
arch: amd64
os: linux
monitoring_servers: - host: 10.114.26.102
ssh_port: 22
port: 9090
ng_port: 12020
deploy_dir: /data13/tidb/deploy/prometheus-9090
data_dir: /data13/tidb/data/prometheus-9090
log_dir: /data13/tidb/deploy/prometheus-9090/log
external_alertmanagers: []
arch: amd64
os: linux - host: 10.114.26.105
ssh_port: 22
port: 9090
ng_port: 12020
deploy_dir: /data13/tidb/deploy/prometheus-9090
data_dir: /data13/tidb/data/prometheus-9090
log_dir: /data13/tidb/deploy/prometheus-9090/log
external_alertmanagers: []
arch: amd64
os: linux - host: 10.114.26.111
ssh_port: 22
port: 9090
ng_port: 12020
deploy_dir: /data13/tidb/deploy/prometheus-9090
data_dir: /data13/tidb/data/prometheus-9090
log_dir: /data13/tidb/deploy/prometheus-9090/log
external_alertmanagers: []
arch: amd64
os: linux
grafana_servers: - host: 10.114.26.103
ssh_port: 22
port: 3001
deploy_dir: /data13/tidb/deploy/grafana-3001
arch: amd64
os: linux
username: admin
password: admin
anonymous_enable: false
root_url: “”
domain: “”
