【 TiDB 使用环境】生产环境
【 TiDB 版本】v7.1.1
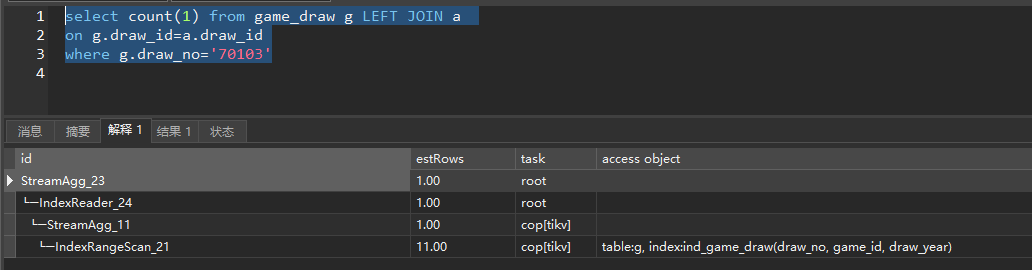
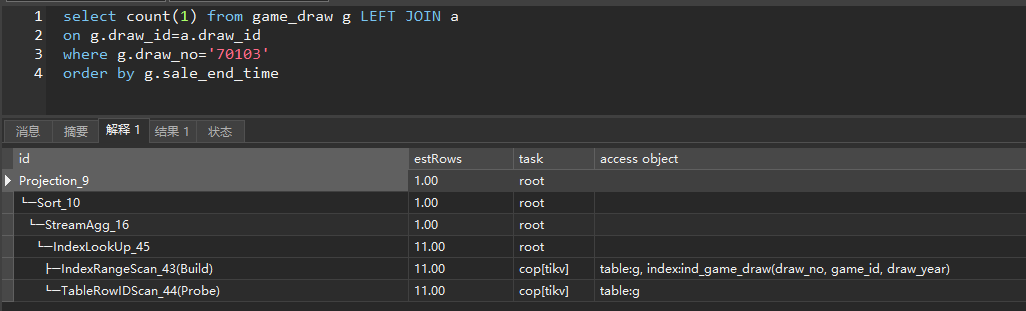
【复现路径】left join 在count查询时是无用的关联,有orderby会自动剪裁掉右表。
【遇到的问题:问题现象及影响】
查询一:explain analyze SELECT count(0) FROM rrs_attend_partition t LEFT JOIN rrs_person rp on t.person_id = rp.id WHERE 1 = 1 AND t.project_id = ‘5678a656095428683fef6a90801b4ba’;
查询二: explain analyze SELECT count(0) FROM rrs_attend_partition t LEFT JOIN rrs_person rp on t.person_id = rp.id WHERE 1 = 1 AND t.project_id = ‘5678a656095428683fef6a90801b4ba’ order by t.create_time;
count 有orderby更快,是优化慢sql偶然发现的。
生产是没有orderby的,本想让其保持orderby进行count,无奈用的pagehelper分页插件,自动删除orderby。
问题:有orderby 的sql性能远远优于没有的性能。
请问为什么要取决于order by 进行剪裁,实现逻辑是什么。 如何使查询一 和查询二 的性能一致。
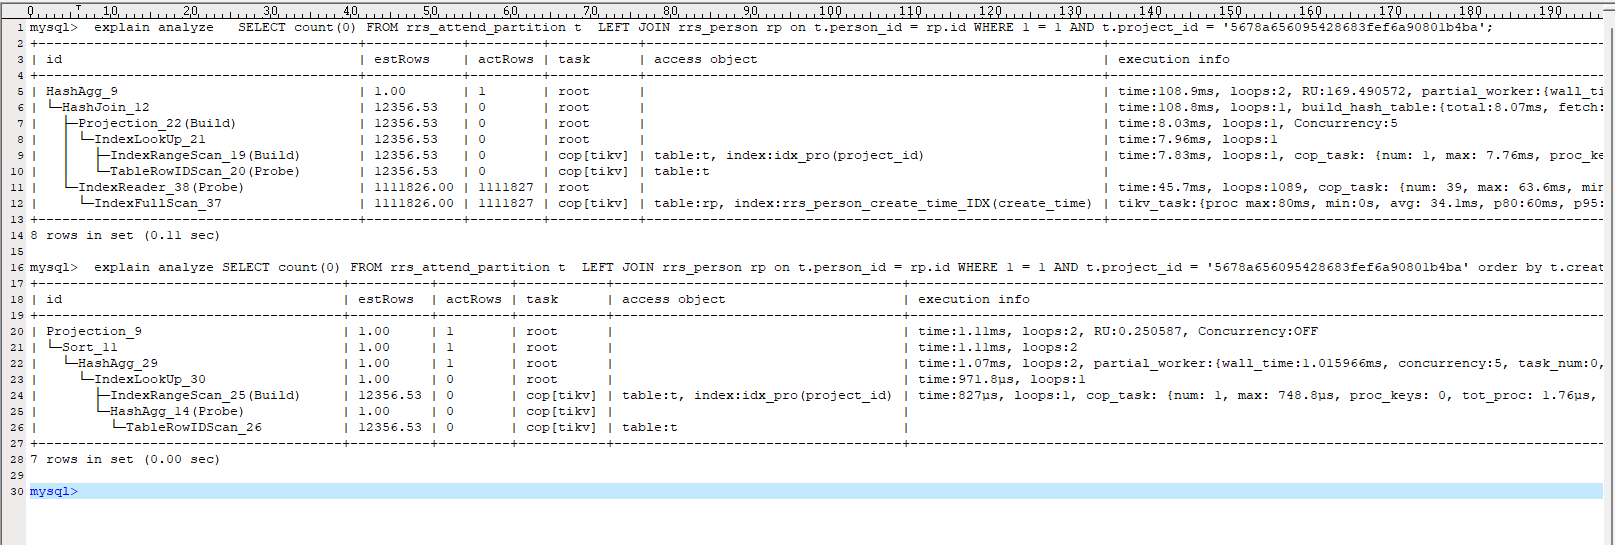
mysql> explain analyze SELECT count(0) FROM rrs_attend_partition t LEFT JOIN rrs_person rp on t.person_id = rp.id WHERE 1 = 1 AND t.project_id = ‘5678a656095428683fef6a90801b4ba’;
±---------------------------------------±-----------±--------±----------±--------------------------------------------------------±-----------------------------------------------------------------------------------------------------------------------------------------------------------------------------------------------------------------------------------------------------------------------------------------------------------------------------------------------------------------------------------------------------------------------±-------------------------------------------------------------------------------------------------------±----------±--------+
| id | estRows | actRows | task | access object | execution info | operator info | memory | disk |
±---------------------------------------±-----------±--------±----------±--------------------------------------------------------±-----------------------------------------------------------------------------------------------------------------------------------------------------------------------------------------------------------------------------------------------------------------------------------------------------------------------------------------------------------------------------------------------------------------------±-------------------------------------------------------------------------------------------------------±----------±--------+
| HashAgg_9 | 1.00 | 1 | root | | time:108.9ms, loops:2, RU:169.490572, partial_worker:{wall_time:108.894854ms, concurrency:5, task_num:0, tot_wait:543.994585ms, tot_exec:0s, tot_time:543.997945ms, max:108.807093ms, p95:108.807093ms}, final_worker:{wall_time:108.919395ms, concurrency:5, task_num:0, tot_wait:544.097297ms, tot_exec:10.183µs, tot_time:544.11254ms, max:108.829544ms, p95:108.829544ms} | funcs:count(0)->Column#69 | 6.15 KB | N/A |
| └─HashJoin_12 | 12356.53 | 0 | root | | time:108.8ms, loops:1, build_hash_table:{total:8.07ms, fetch:8.07ms, build:0s}, probe:{concurrency:5, total:542.8ms, max:108.6ms, probe:293.6ms, fetch:249.2ms} | left outer join, equal:[eq(prod_sjzt_smz.rrs_attend_partition.person_id, prod_sjzt_smz.rrs_person.id)] | 0 Bytes | 0 Bytes |
| ├─Projection_22(Build) | 12356.53 | 0 | root | | time:8.03ms, loops:1, Concurrency:5 | prod_sjzt_smz.rrs_attend_partition.project_id, prod_sjzt_smz.rrs_attend_partition.person_id | 46.4 KB | N/A |
| │ └─IndexLookUp_21 | 12356.53 | 0 | root | | time:7.96ms, loops:1 | | 296 Bytes | N/A |
| │ ├─IndexRangeScan_19(Build) | 12356.53 | 0 | cop[tikv] | table:t, index:idx_pro(project_id) | time:7.83ms, loops:1, cop_task: {num: 1, max: 7.76ms, proc_keys: 0, tot_proc: 6.05ms, tot_wait: 947.7µs, rpc_num: 1, rpc_time: 7.74ms, copr_cache_hit_ratio: 0.00, build_task_duration: 28.5µs, max_distsql_concurrency: 1}, tikv_task:{time:10ms, loops:1}, scan_detail: {total_keys: 1, get_snapshot_time: 883.2µs, rocksdb: {block: {cache_hit_count: 5, read_count: 4, read_byte: 79.4 KB, read_time: 5.44ms}}} | range:[“5678a656095428683fef6a90801b4ba”,“5678a656095428683fef6a90801b4ba”], keep order:false | N/A | N/A |
| │ └─TableRowIDScan_20(Probe) | 12356.53 | 0 | cop[tikv] | table:t | | keep order:false | N/A | N/A |
| └─IndexReader_38(Probe) | 1111826.00 | 1111827 | root | | time:45.7ms, loops:1089, cop_task: {num: 39, max: 63.6ms, min: 412.6µs, avg: 2.26ms, p95: 2.35ms, max_proc_keys: 50144, p95_proc_keys: 992, tot_proc: 63.5ms, tot_wait: 2.13ms, rpc_num: 39, rpc_time: 87.2ms, copr_cache_hit_ratio: 0.85, build_task_duration: 28µs, max_distsql_concurrency: 2} | index:IndexFullScan_37 | 3.83 MB | N/A |
| └─IndexFullScan_37 | 1111826.00 | 1111827 | cop[tikv] | table:rp, index:rrs_person_create_time_IDX(create_time) | tikv_task:{proc max:80ms, min:0s, avg: 34.1ms, p80:60ms, p95:70ms, iters:1240, tasks:39}, scan_detail: {total_process_keys: 52544, total_process_keys_size: 8932480, total_keys: 52550, get_snapshot_time: 670.5µs, rocksdb: {delete_skipped_count: 57, key_skipped_count: 52601, block: {cache_hit_count: 362}}} | keep order:false | N/A | N/A |
±---------------------------------------±-----------±--------±----------±--------------------------------------------------------±-----------------------------------------------------------------------------------------------------------------------------------------------------------------------------------------------------------------------------------------------------------------------------------------------------------------------------------------------------------------------------------------------------------------------±-------------------------------------------------------------------------------------------------------±----------±--------+
8 rows in set (0.11 sec)
mysql> explain analyze SELECT count(0) FROM rrs_attend_partition t LEFT JOIN rrs_person rp on t.person_id = rp.id WHERE 1 = 1 AND t.project_id = ‘5678a656095428683fef6a90801b4ba’ order by t.create_time;
±-------------------------------------±---------±--------±----------±-----------------------------------±--------------------------------------------------------------------------------------------------------------------------------------------------------------------------------------------------------------------------------------------------------------------------------------------------------------------------------------±-------------------------------------------------------------------------------------------------------------±----------±--------+
| id | estRows | actRows | task | access object | execution info | operator info | memory | disk |
±-------------------------------------±---------±--------±----------±-----------------------------------±--------------------------------------------------------------------------------------------------------------------------------------------------------------------------------------------------------------------------------------------------------------------------------------------------------------------------------------±-------------------------------------------------------------------------------------------------------------±----------±--------+
| Projection_9 | 1.00 | 1 | root | | time:1.11ms, loops:2, RU:0.250587, Concurrency:OFF | Column#69 | 760 Bytes | N/A |
| └─Sort_11 | 1.00 | 1 | root | | time:1.11ms, loops:2 | prod_sjzt_smz.rrs_attend_partition.create_time | 768 Bytes | 0 Bytes |
| └─HashAgg_29 | 1.00 | 1 | root | | time:1.07ms, loops:2, partial_worker:{wall_time:1.015966ms, concurrency:5, task_num:0, tot_wait:4.92656ms, tot_exec:0s, tot_time:4.93226ms, max:991.886µs, p95:991.886µs}, final_worker:{wall_time:1.035576ms, concurrency:5, task_num:0, tot_wait:4.99453ms, tot_exec:6.07µs, tot_time:5.00488ms, max:1.008516ms, p95:1.008516ms} | funcs:count(Column#73)->Column#69, funcs:firstrow(Column#74)->prod_sjzt_smz.rrs_attend_partition.create_time | 13.6 KB | N/A |
| └─IndexLookUp_30 | 1.00 | 0 | root | | time:971.8µs, loops:1 | | 252 Bytes | N/A |
| ├─IndexRangeScan_25(Build) | 12356.53 | 0 | cop[tikv] | table:t, index:idx_pro(project_id) | time:827µs, loops:1, cop_task: {num: 1, max: 748.8µs, proc_keys: 0, tot_proc: 1.76µs, tot_wait: 125.2µs, rpc_num: 1, rpc_time: 713.2µs, copr_cache_hit_ratio: 1.00, build_task_duration: 33.6µs, max_distsql_concurrency: 1}, tikv_task:{time:10ms, loops:1}, scan_detail: {get_snapshot_time: 48.1µs, rocksdb: {block: {}}} | range:[“5678a656095428683fef6a90801b4ba”,“5678a656095428683fef6a90801b4ba”], keep order:false | N/A | N/A |
| └─HashAgg_14(Probe) | 1.00 | 0 | cop[tikv] | | | funcs:count(0)->Column#73, funcs:firstrow(prod_sjzt_smz.rrs_attend_partition.create_time)->Column#74 | N/A | N/A |
| └─TableRowIDScan_26 | 12356.53 | 0 | cop[tikv] | table:t | | keep order:false | N/A | N/A |
±-------------------------------------±---------±--------±----------±-----------------------------------±--------------------------------------------------------------------------------------------------------------------------------------------------------------------------------------------------------------------------------------------------------------------------------------------------------------------------------------±-------------------------------------------------------------------------------------------------------------±----------±--------+
7 rows in set (0.00 sec)
mysql>