【 TiDB 使用环境】生产环境
【 TiDB 版本】6.5.1
【复现路径】
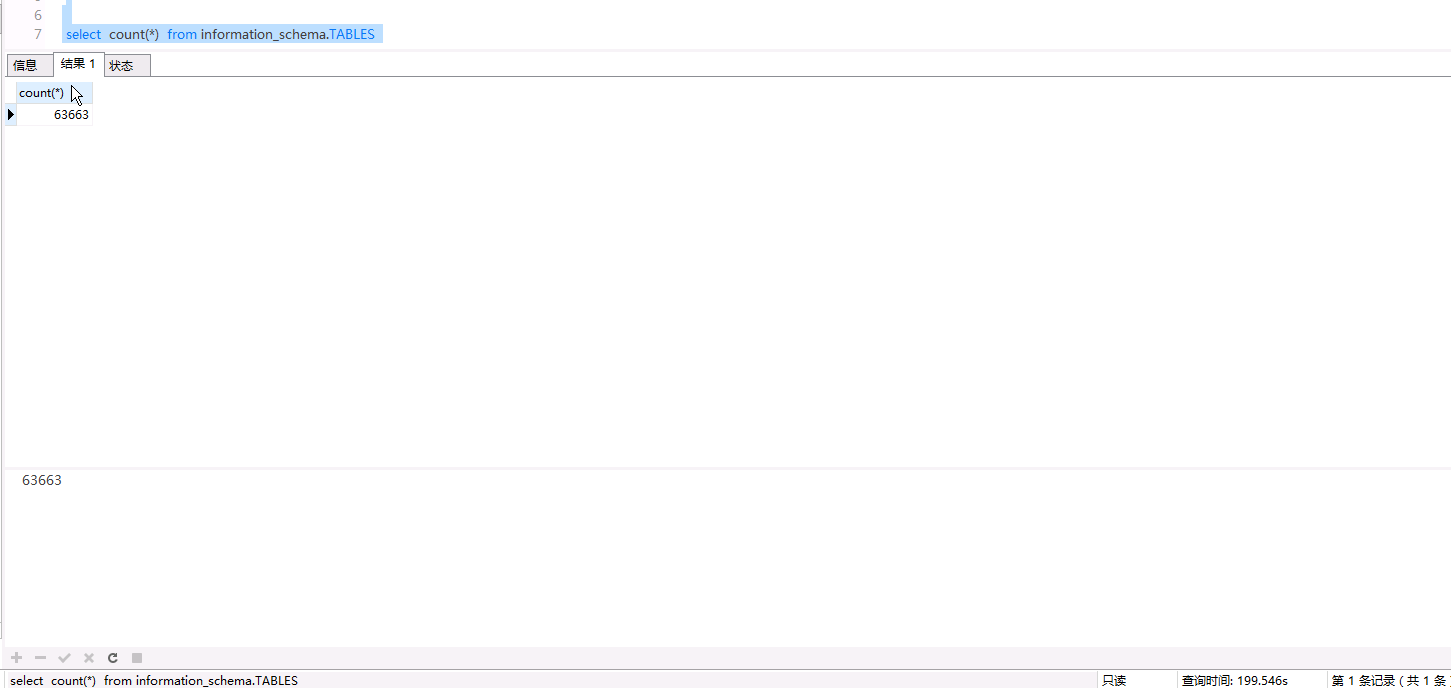
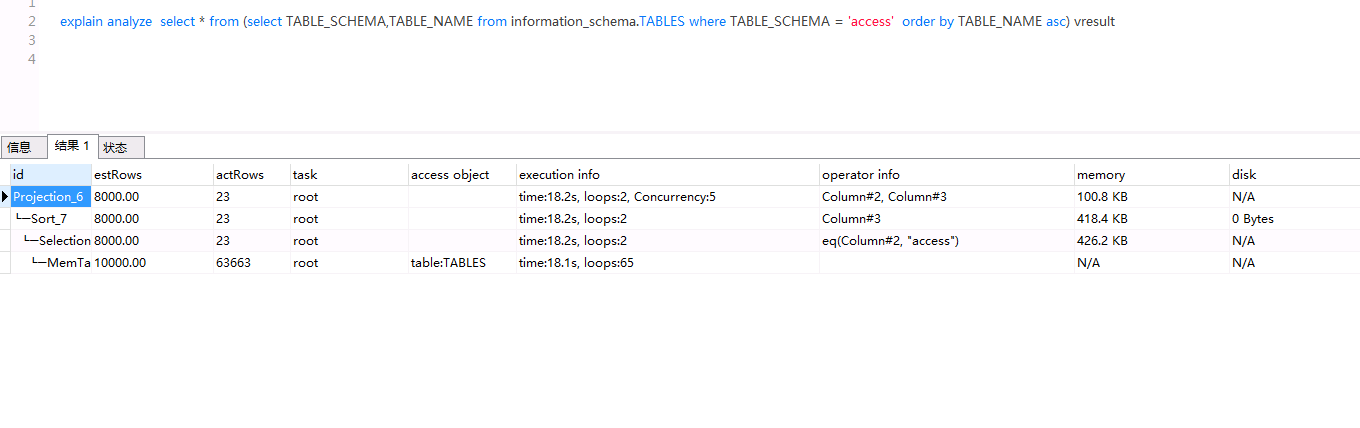
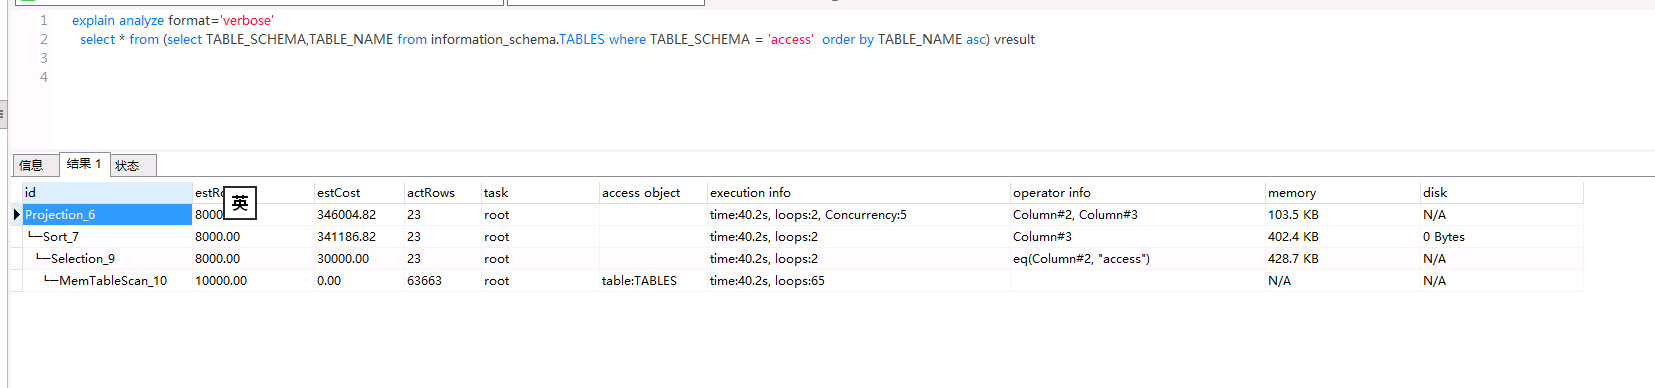
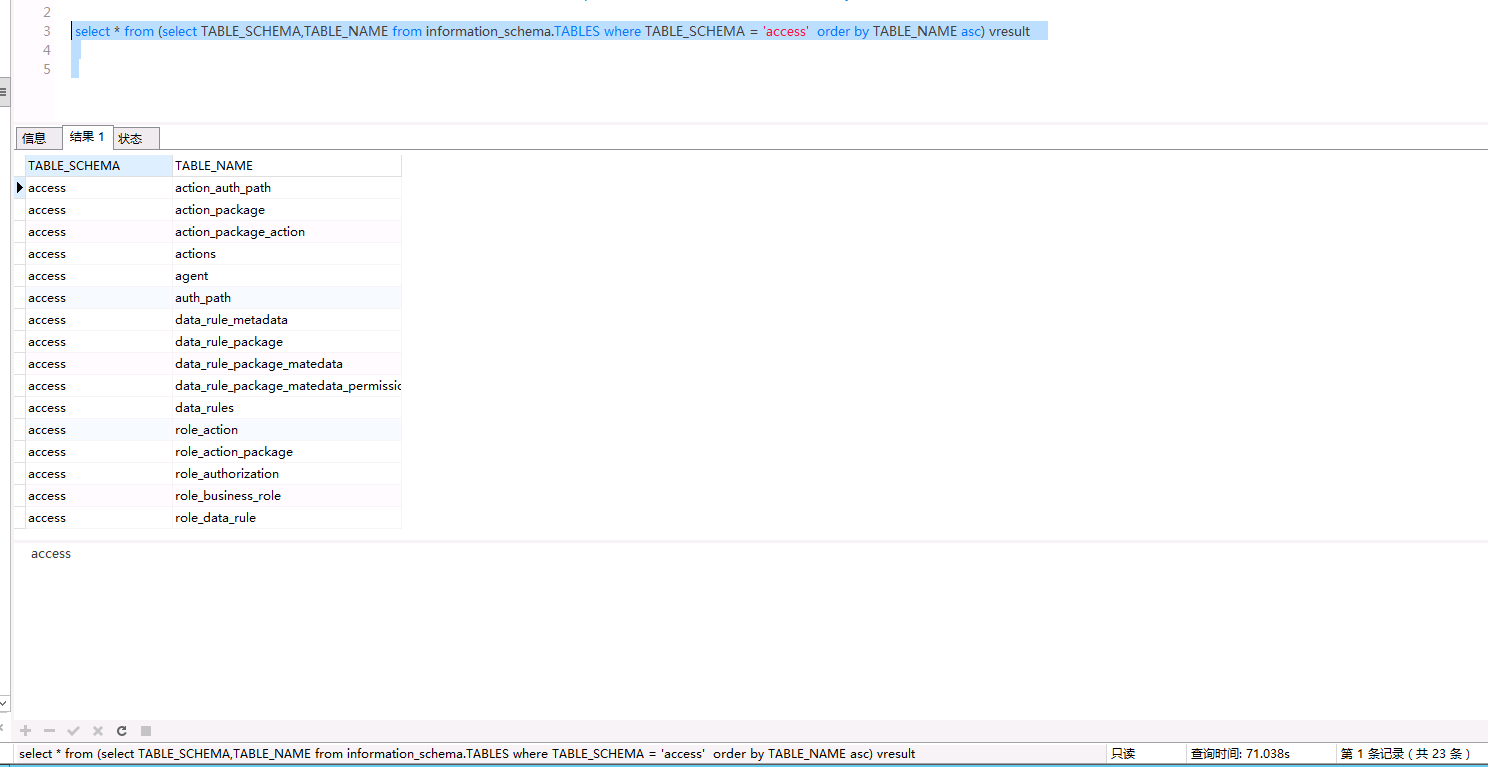
select * from (select TABLE_SCHEMA,TABLE_NAME from information_schema.TABLES where TABLE_SCHEMA = ‘access’ order by TABLE_NAME asc) vresult
查询很慢,时间10几秒到100多秒不等
结果集 23条
总条数:63663
【 TiDB 使用环境】生产环境
【 TiDB 版本】6.5.1
【复现路径】
select * from (select TABLE_SCHEMA,TABLE_NAME from information_schema.TABLES where TABLE_SCHEMA = ‘access’ order by TABLE_NAME asc) vresult
查询很慢,时间10几秒到100多秒不等
结果集 23条
总条数:63663
dashboard上看看各节点的负载?
![]() 你这个负载是不是有点过高了,直接count(*)试试呢?
你这个负载是不是有点过高了,直接count(*)试试呢?
count也慢,上面有图,其实负载 还好
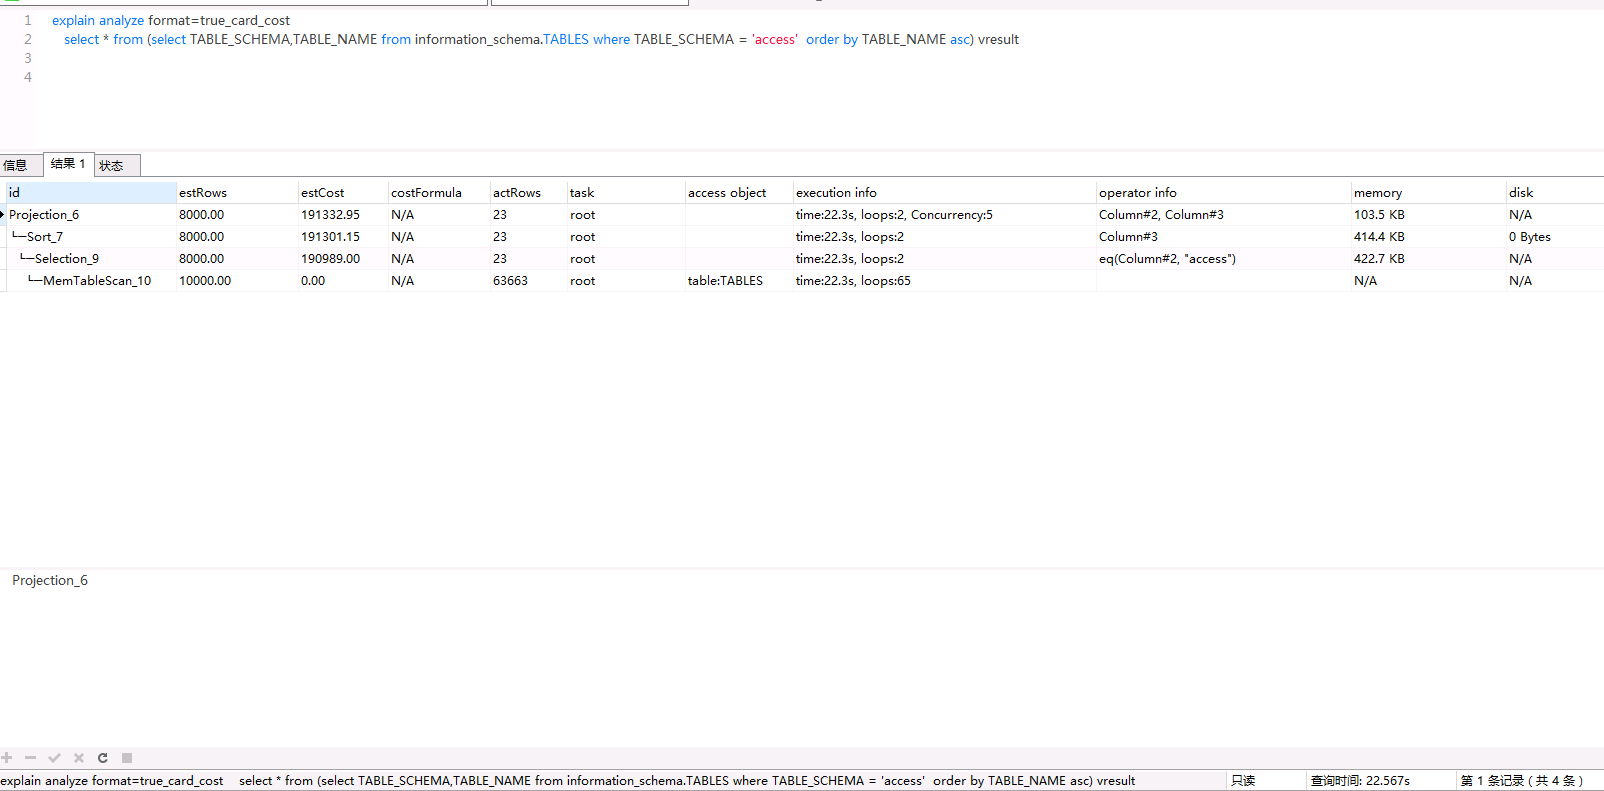
explain analyze format=true_card_cost 用这个再输出一个执行计划
![]() 不知道是不是版本的原因,我7.5输出是有CPU和内存的具体开销
不知道是不是版本的原因,我7.5输出是有CPU和内存的具体开销
mysql> explain analyze format=true_card_cost select * from (select TABLE_SCHEMA,TABLE_NAME from information_schema.TABLES where TABLE_SCHEMA = 'mysql' order by TABLE_NAME asc) vresult;
+---------------------------+----------+----------+------------------------------------------------------------------------------------------------------------------------------------------------------------------------------------------------------------------------------------------------+---------+------+---------------+--------------------------------------------------+-----------------------+----------+---------+
| id                        | estRows  | estCost  | costFormula                                                                                                                                                                                                                                    | actRows | task | access object | execution info                                   | operator info         | memory   | disk    |
+---------------------------+----------+----------+------------------------------------------------------------------------------------------------------------------------------------------------------------------------------------------------------------------------------------------------+---------+------+---------------+--------------------------------------------------+-----------------------+----------+---------+
| Projection_6              | 8000.00  | 77180.72 | (((cpu(852*filters(1)*tidb_cpu_factor(49.9))) + ()) + ((exprCPU(55*0*tidb_cpu_factor(49.9))) + (orderCPU(55*log(55)*tidb_cpu_factor(49.9)))) + (sortMem(55*1708*tidb_mem_factor(0.2)))) + ((cpu(55*filters(0.02)*tidb_cpu_factor(49.9)))/5.00) | 55      | root |               | time:9.24ms, loops:2, RU:0.000000, Concurrency:5 | Column#2, Column#3    | 77.9 KB  | N/A     |
| └─Sort_7                  | 8000.00  | 77169.74 | ((cpu(852*filters(1)*tidb_cpu_factor(49.9))) + ()) + ((exprCPU(55*0*tidb_cpu_factor(49.9))) + (orderCPU(55*log(55)*tidb_cpu_factor(49.9)))) + (sortMem(55*1708*tidb_mem_factor(0.2)))                                                          | 55      | root |               | time:9.14ms, loops:2                             | Column#3              | 250.4 KB | 0 Bytes |
|   └─Selection_9           | 8000.00  | 42514.80 | (cpu(852*filters(1)*tidb_cpu_factor(49.9))) + ()                                                                                                                                                                                               | 55      | root |               | time:9.05ms, loops:2                             | eq(Column#2, "mysql") | 297.5 KB | N/A     |
|     └─MemTableScan_10     | 10000.00 | 0.00     |                                                                                                                                                                                                                                                | 852     | root | table:TABLES  | time:8.95ms, loops:3                             |                       | N/A      | N/A     |
+---------------------------+----------+----------+------------------------------------------------------------------------------------------------------------------------------------------------------------------------------------------------------------------------------------------------+---------+------+---------------+--------------------------------------------------+-----------------------+----------+---------+
4 rows in set, 4 warnings (0.02 sec)
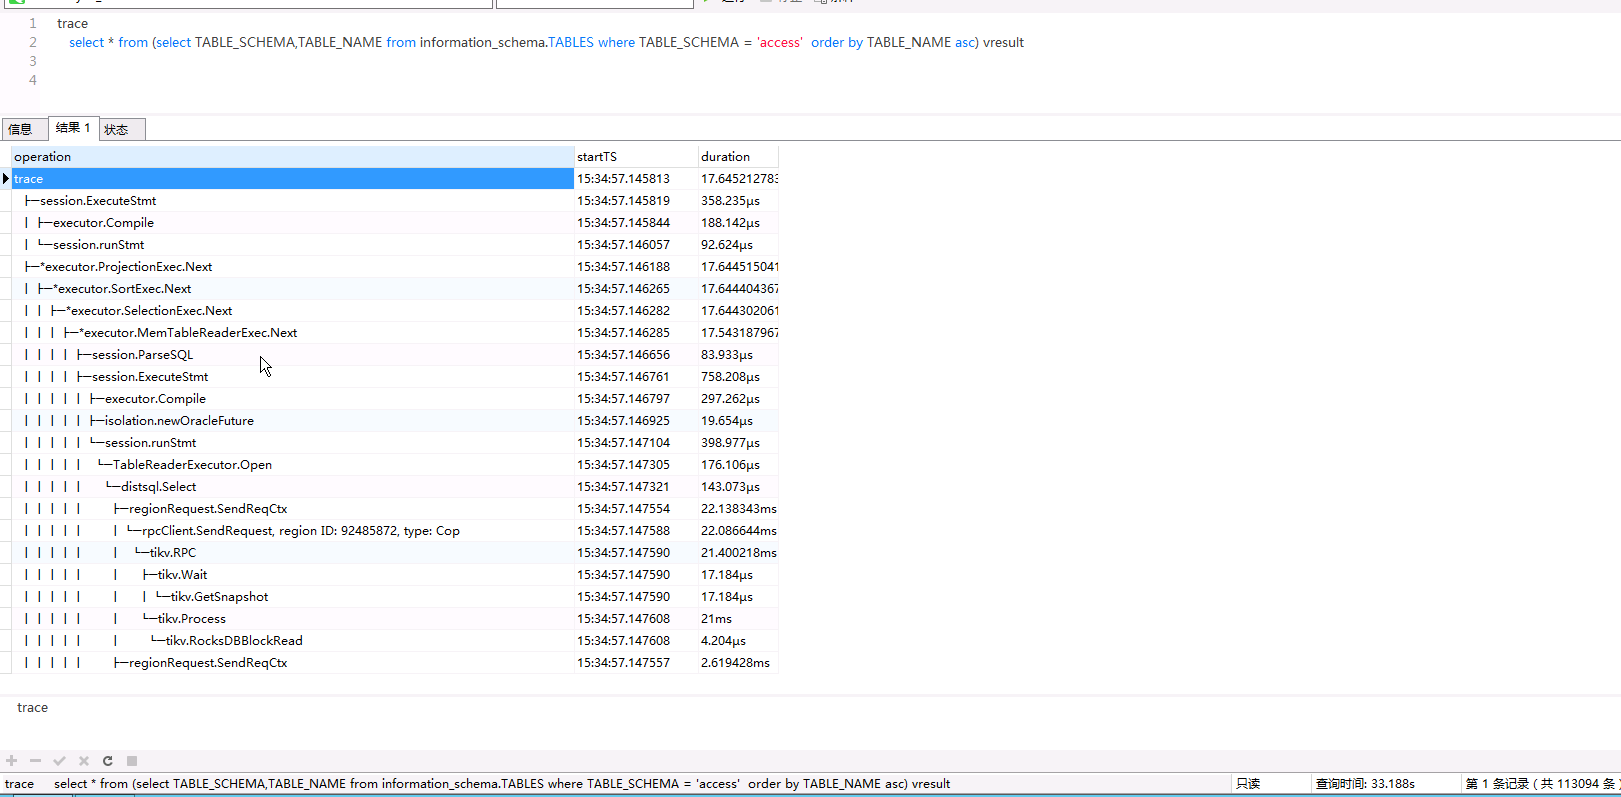
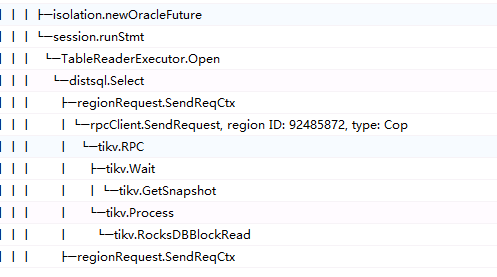
再用trace select 试试?
trace select * from (select TABLE_SCHEMA,TABLE_NAME from information_schema.TABLES where TABLE_SCHEMA = ‘access’ order by TABLE_NAME asc) vresult;
mysql> trace select * from (select TABLE_SCHEMA,TABLE_NAME from information_schema.TABLES where TABLE_SCHEMA = 'mysql' order by TABLE_NAME asc) vresult;
+-------------------------------------------------------+-----------------+-------------+
| operation                                             | startTS         | duration    |
+-------------------------------------------------------+-----------------+-------------+
| trace                                                 | 15:33:27.484968 | 12.086123ms |
|   ├─session.ExecuteStmt                               | 15:33:27.485711 | 2.354008ms  |
|   │ ├─executor.Compile                                | 15:33:27.485728 | 270.31µs    |
|   │ └─session.runStmt                                 | 15:33:27.487302 | 344.126µs   |
|   ├─*executor.ProjectionExec.Next                     | 15:33:27.488073 | 8.934055ms  |
|   │ ├─*executor.SortExec.Next                         | 15:33:27.488149 | 8.830804ms  |
|   │ │ ├─*executor.SelectionExec.Next                  | 15:33:27.488170 | 8.724945ms  |
|   │ │ │ ├─*executor.MemTableReaderExec.Next           | 15:33:27.488173 | 8.583582ms  |
|   │ │ │ └─*executor.MemTableReaderExec.Next           | 15:33:27.496887 | 2.347µs     |
|   │ │ └─*executor.SelectionExec.Next                  | 15:33:27.496908 | 5.867µs     |
|   │ │   └─*executor.MemTableReaderExec.Next           | 15:33:27.496910 | 468ns       |
|   │ └─*executor.SortExec.Next                         | 15:33:27.496993 | 814ns       |
|   └─*executor.ProjectionExec.Next                     | 15:33:27.497014 | 1.05µs      |
+-------------------------------------------------------+-----------------+-------------+
13 rows in set (0.02 sec)
能在终端上执行下吗?或者贴个完整的,可以看看具体哪一步慢
另外tidb上是不是在不停建表? ![]()
没有啊
有在同步数据
我不知道这块是不是因为在频繁更元数据造成的。。,我在空闲测试库上反复试了,执行计划总是一样(schema不停换)
我的虚拟机环境(实验),直接运行括号里的SQL语句,用时0.01S,运行你的完整的SQL语句,用时0.02S。637条记录。
唯一区别是关键字我全大写了(比如SELECT FROM)