TiDB 6.5.2 升级到7.1.0报错

【 TiDB 使用环境】生产环境
【 TiDB 版本】7.1.0
【复现路径】做过哪些操作出现的问题
tiup cluster upgrade tidb-cluster v7.1.0
【遇到的问题:问题现象及影响】

Upgrading component tidb
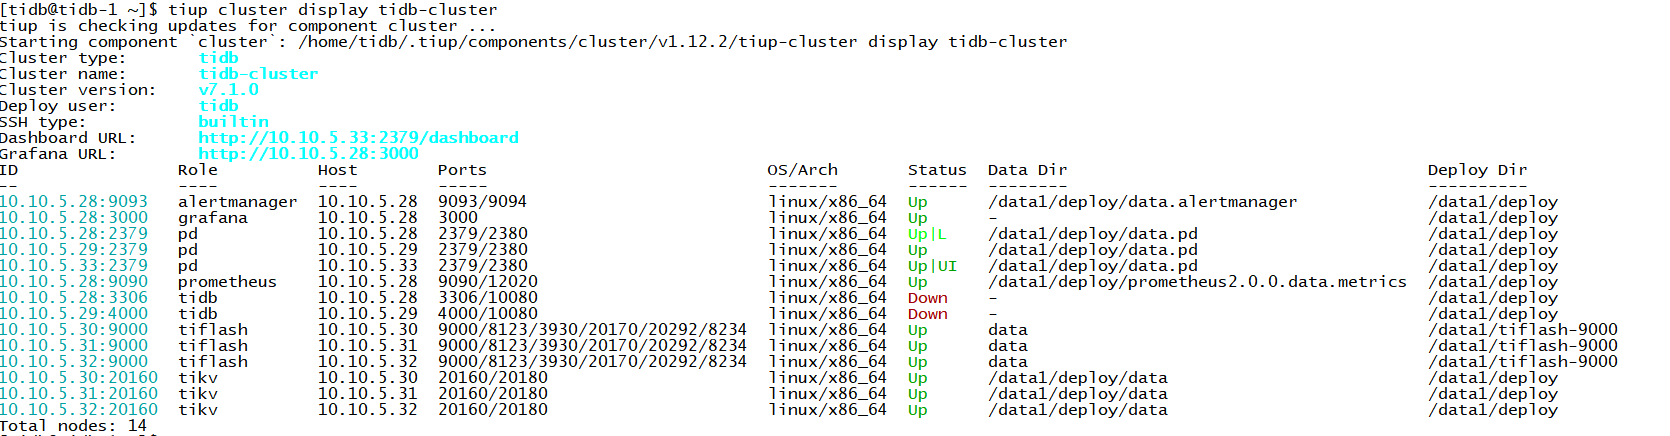
        Restarting instance 10.10.5.28:3306

Error: failed to restart: 10.10.5.28 tidb-3306.service, please check the instance's log(/data1/deploy/log) for more detail.: timed out waiting for port 3306 to be started after 2m0s

Verbose debug logs has been written to /home/tidb/.tiup/logs/tiup-cluster-debug-2023-06-05-22-59-43.log.

【资源配置】
【附件:截图/日志/监控】
tidb.log

[2023/06/05 22:57:43.848 +08:00] [INFO] [owner_daemon.go:81] ["begin running daemon"] [id=f6cc546c-de99-4c0d-b104-5bab6fc17e22] [daemon-id=LogBackup::Advancer]
[2023/06/05 22:57:43.855 +08:00] [INFO] [session.go:3852] ["CRUCIAL OPERATION"] [conn=0] [schemaVersion=130240] [cur_db=] [sql="ALTER TABLE mysql.stats_meta_history ADD COLUMN IF NOT EXISTS `source` varchar(40) NOT NULL after `version`;"] [user=]
[2023/06/05 22:57:43.856 +08:00] [INFO] [session.go:3852] ["CRUCIAL OPERATION"] [conn=0] [schemaVersion=130240] [cur_db=] [sql="CREATE TABLE IF NOT EXISTS mysql.tidb_ttl_task (\n\t\tjob_id varchar(64) NOT NULL,\n\t\ttable_id bigint(64) NOT NULL,\n\t\tscan_id int NOT NULL,\n\t\tscan_range_start BLOB,\n\t\tscan_range_end BLOB,\n\t\texpire_time timestamp NOT NULL,\n\t\towner_id varchar(64) DEFAULT NULL,\n\t\towner_addr varchar(64) DEFAULT NULL,\n\t\towner_hb_time timestamp DEFAULT NULL,\n\t\tstatus varchar(64) DEFAULT 'waiting',\n\t\tstatus_update_time timestamp NULL DEFAULT NULL,\n\t\tstate text,\n\t\tcreated_time timestamp NOT NULL,\n\t\tprimary key(job_id, scan_id),\n\t\tkey(created_time));"] [user=]
[2023/06/05 22:57:43.856 +08:00] [INFO] [session.go:3852] ["CRUCIAL OPERATION"] [conn=0] [schemaVersion=130240] [cur_db=] [sql="CREATE TABLE IF NOT EXISTS mysql.tidb_ttl_job_history (\n\t\tjob_id varchar(64) PRIMARY KEY,\n\t\ttable_id bigint(64) NOT NULL,\n        parent_table_id bigint(64) NOT NULL,\n    \ttable_schema varchar(64) NOT NULL,\n\t\ttable_name varchar(64) NOT NULL,\n    \tpartition_name varchar(64) DEFAULT NULL,\n\t\tcreate_time timestamp NOT NULL,\n\t\tfinish_time timestamp NOT NULL,\n\t\tttl_expire timestamp NOT NULL,\n        summary_text text,\n\t\texpired_rows bigint(64) DEFAULT NULL,\n    \tdeleted_rows bigint(64) DEFAULT NULL,\n    \terror_delete_rows bigint(64) DEFAULT NULL,\n    \tstatus varchar(64) NOT NULL,\n    \tkey(table_schema, table_name, create_time),\n    \tkey(parent_table_id, create_time),\n    \tkey(create_time)\n\t);"] [user=]
[2023/06/05 22:57:43.904 +08:00] [INFO] [ddl_worker.go:238] ["[ddl] add DDL jobs"] ["batch count"=1] [jobs="ID:123481, Type:create view, State:queueing, SchemaState:none, SchemaID:3, TableID:123480, RowCount:0, ArgLen:3, start time: 2023-06-05 22:57:43.999 +0800 CST, Err:<nil>, ErrCount:0, SnapshotVersion:0; "] [table=true]
[2023/06/05 22:57:43.906 +08:00] [INFO] [ddl.go:1056] ["[ddl] start DDL job"] [job="ID:123481, Type:create view, State:queueing, SchemaState:none, SchemaID:3, TableID:123480, RowCount:0, ArgLen:3, start time: 2023-06-05 22:57:43.999 +0800 CST, Err:<nil>, ErrCount:0, SnapshotVersion:0"] [query="CREATE OR REPLACE VIEW mysql.tidb_mdl_view as (\n\t\tSELECT job_id,\n\t\t\tdb_name,\n\t\t\ttable_name,\n\t\t\tquery,\n\t\t\tsession_id,\n\t\t\ttxnstart,\n\t\t\ttidb_decode_sql_digests(all_sql_digests, 4096) AS SQL_DIGESTS\n\t\tFROM information_schema.ddl_jobs,\n\t\t\tinformation_schema.cluster_tidb_trx,\n\t\t\tinformation_schema.cluster_processlist\n\t\tWHERE (ddl_jobs.state != 'synced' and ddl_jobs.state != 'cancelled')\n\t\t\tAND Find_in_set(ddl_jobs.table_id, cluster_tidb_trx.related_table_ids)\n\t\t\tAND cluster_tidb_trx.session_id = cluster_processlist.id\n\t);"]
[2023/06/05 22:57:45.843 +08:00] [INFO] [info.go:1189] [SetTiFlashGroupConfig]
[2023/06/05 22:58:06.347 +08:00] [WARN] [domain.go:215] ["failed to get schema version"] [error="There is no Write MVCC info for the schema version"] [version=130240]
[2023/06/05 22:58:28.847 +08:00] [WARN] [domain.go:215] ["failed to get schema version"] [error="There is no Write MVCC info for the schema version"] [version=130240]
[2023/06/05 22:58:51.347 +08:00] [WARN] [domain.go:215] ["failed to get schema version"] [error="There is no Write MVCC info for the schema version"] [version=130240]
[2023/06/05 22:59:13.847 +08:00] [WARN] [domain.go:215] ["failed to get schema version"] [error="There is no Write MVCC info for the schema version"] [version=130240]
[2023/06/05 22:59:36.348 +08:00] [WARN] [domain.go:215] ["failed to get schema version"] [error="There is no Write MVCC info for the schema version"] [version=130240]
[2023/06/05 22:59:58.847 +08:00] [WARN] [domain.go:215] ["failed to get schema version"] [error="There is no Write MVCC info for the schema version"] [version=130240]
[2023/06/05 23:00:21.347 +08:00] [WARN] [domain.go:215] ["failed to get schema version"] [error="There is no Write MVCC info for the schema version"] [version=130240]
[2023/06/05 23:00:43.847 +08:00] [WARN] [domain.go:215] ["failed to get schema version"] [error="There is no Write MVCC info for the schema version"] [version=130240]
[2023/06/05 23:01:06.347 +08:00] [WARN] [domain.go:215] ["failed to get schema version"] [error="There is no Write MVCC info for the schema version"] [version=130240]

业务繁忙吧,考虑找个时间关了数据库升级

下午就试着升级了,结果没成功,服务就一直没起来。也就没有啥业务连接了。

升级的时候 集群有在做ddl么

没有,数据库已经连不上了。

嗯 好的

刚试了下离线升级,先执行tiup cluster stop tidb-cluster,然后执行 tiup cluster upgrade tidb-cluster v7.1.0 --offline,提示 Upgraded cluster tidb-cluster successfully。但是tiup cluster start tidb-cluster 依然报错,

Starting component tidb
        Starting instance 10.10.5.29:4000
        Starting instance 10.10.5.28:3306

Error: failed to start tidb: failed to start: 10.10.5.29 tidb-4000.service, please check the instance's log(/data1/deploy/log) for more detail.: timed out waiting for port 4000 to be started after 2m0s

Verbose debug logs has been written to /home/tidb/.tiup/logs/tiup-cluster-debug-2023-06-05-23-18-43.log.

tidb.log:

[2023/06/05 23:16:57.398 +08:00] [INFO] [info.go:1189] [SetTiFlashGroupConfig]
[2023/06/05 23:17:17.901 +08:00] [WARN] [domain.go:215] ["failed to get schema version"] [error="There is no Write MVCC info for the schema version"] [version=130240]
[2023/06/05 23:17:40.402 +08:00] [WARN] [domain.go:215] ["failed to get schema version"] [error="There is no Write MVCC info for the schema version"] [version=130240]
[2023/06/05 23:18:02.901 +08:00] [WARN] [domain.go:215] ["failed to get schema version"] [error="There is no Write MVCC info for the schema version"] [version=130240]
[2023/06/05 23:18:25.402 +08:00] [WARN] [domain.go:215] ["failed to get schema version"] [error="There is no Write MVCC info for the schema version"] [version=130240]
[2023/06/05 23:18:47.901 +08:00] [WARN] [domain.go:215] ["failed to get schema version"] [error="There is no Write MVCC info for the schema version"] [version=130240]
[2023/06/05 23:19:10.402 +08:00] [WARN] [domain.go:215] ["failed to get schema version"] [error="There is no Write MVCC info for the schema version"] [version=130240]
[2023/06/05 23:19:32.901 +08:00] [WARN] [domain.go:215] ["failed to get schema version"] [error="There is no Write MVCC info for the schema version"] [version=130240]
[2023/06/05 23:19:55.402 +08:00] [WARN] [domain.go:215] ["failed to get schema version"] [error="There is no Write MVCC info for the schema version"] [version=130240]
[2023/06/05 23:20:17.901 +08:00] [WARN] [domain.go:215] ["failed to get schema version"] [error="There is no Write MVCC info for the schema version"] [version=130240]
[2023/06/05 23:20:40.401 +08:00] [WARN] [domain.go:215] ["failed to get schema version"] [error="There is no Write MVCC info for the schema version"] [version=130240]
[2023/06/05 23:21:02.901 +08:00] [WARN] [domain.go:215] ["failed to get schema version"] [error="There is no Write MVCC info for the schema version"] [version=130240]
[2023/06/05 23:21:25.402 +08:00] [WARN] [domain.go:215] ["failed to get schema version"] [error="There is no Write MVCC info for the schema version"] [version=130240]
[2023/06/05 23:21:47.901 +08:00] [WARN] [domain.go:215] ["failed to get schema version"] [error="There is no Write MVCC info for the schema version"] [version=130240]
[2023/06/05 23:21:54.582 +08:00] [INFO] [domain.go:2652] ["refreshServerIDTTL succeed"] [serverID=3629854] ["lease id"=76df888c21a2cb56]
[2023/06/05 23:22:10.402 +08:00] [WARN] [domain.go:215] ["failed to get schema version"] [error="There is no Write MVCC info for the schema version"] [version=130240]
[2023/06/05 23:22:32.901 +08:00] [WARN] [domain.go:215] ["failed to get schema version"] [error="There is no Write MVCC info for the schema version"] [version=130240]
[2023/06/05 23:22:55.403 +08:00] [WARN] [domain.go:215] ["failed to get schema version"] [error="There is no Write MVCC info for the schema version"] [version=130240]
[2023/06/05 23:23:17.902 +08:00] [WARN] [domain.go:215] ["failed to get schema version"] [error="There is no Write MVCC info for the schema version"] [version=130240]

这个日志看上去用处不大,有机会彻底重启集群

服务器全部都reboot了一遍,依然还是down的状态,tidb-server 起不来

systemctl status tidb-3306.service 显示是active (running)状态,但是3306端口并没有启动,netstat -ntlp | grep 3306没有查询到,telnet不通。

systemctl stop tidb-3306.service

stop能成功吗?stop了再试试?
顺便看看tidb-3306.service的配置

systemctl stop tidb-3306.service 可以成功,也可以start成功,但是端口并没有起来。

tidb-3306.service

[Unit]
Description=tidb service
After=syslog.target network.target remote-fs.target nss-lookup.target

[Service]
LimitNOFILE=1000000
LimitSTACK=10485760
User=tidb
ExecStart=/bin/bash -c '/data1/deploy/scripts/run_tidb.sh'
Restart=always

RestartSec=15s

[Install]
WantedBy=multi-user.target

cat /data1/deploy/scripts/run_tidb.sh

#!/bin/bash
set -e

# WARNING: This file was auto-generated. Do not edit!
#          All your edit might be overwritten!
DEPLOY_DIR=/data1/deploy

cd "${DEPLOY_DIR}" || exit 1
exec env GODEBUG=madvdontneed=1 bin/tidb-server \
    -P 3306 \
    --status="10080" \
    --host="0.0.0.0" \
    --advertise-address="10.10.5.28" \
    --store="tikv" \
    --initialize-insecure \
    --path="10.10.5.29:2379,10.10.5.28:2379,10.10.5.33:2379" \
    --log-slow-query="/data1/deploy/log/tidb_slow_query.log" \
    --config=conf/tidb.toml \
    --log-file="/data1/deploy/log/tidb.log" 2>> "/data1/deploy/log/tidb_stderr.log"

systemctl status tidb-3306.service

这个输出看看。
另外把参数和日志也发来看看。
/data1/deploy/conf/tidb.toml
/data1/deploy/log/tidb_stderr.log

systemctl status tidb-3306.service

 tidb-3306.service - tidb service
   Loaded: loaded (/etc/systemd/system/tidb-3306.service; enabled; vendor preset: disabled)
   Active: active (running) since Tue 2023-06-06 09:09:26 CST; 18min ago
 Main PID: 32564 (tidb-server)
   CGroup: /system.slice/tidb-3306.service
           └─32564 bin/tidb-server -P 3306 --status=10080 --host=0.0.0.0 --advertise-address=10.10.5.28 --store=tikv --initialize-insecure --path=10.10.5.29:2379,10.10.5.28:2379,10.10.5.33:2379 --log-slow-query=/data1/deploy/log/tidb_slow_query.log --config=conf/tidb.toml --log-file=/data1/deploy/log/tidb.log

cat /data1/deploy/conf/tidb.toml

# WARNING: This file is auto-generated. Do not edit! All your modification will be overwritten!
# You can use 'tiup cluster edit-config' and 'tiup cluster reload' to update the configuration
# All configuration items you want to change can be added to:
# server_configs:
#   tidb:
#     aa.b1.c3: value
#     aa.b2.c4: value
compatible-kill-query = false
enable-streaming = false
host = "0.0.0.0"
lease = "45s"
lower-case-table-names = 2
max-index-length = 3072
oom-action = "log"
run-ddl = true
socket = ""
split-table = true
store = "tikv"
token-limit = 1000

[binlog]
ignore-error = false
write-timeout = "15s"

[log]
disable-timestamp = false
expensive-threshold = 10000
format = "text"
level = "info"
query-log-max-len = 2048
slow-threshold = 300
[log.file]
log-rotate = true
max-backups = 0
max-days = 0
max-size = 300

[opentracing]
enable = false
rpc-metrics = false
[opentracing.reporter]
buffer-flush-interval = 0
local-agent-host-port = ""
log-spans = false
queue-size = 0
[opentracing.sampler]
max-operations = 0
param = 1.0
sampling-refresh-interval = 0
sampling-server-url = ""
type = "const"

[performance]
cross-join = true
feedback-probability = 0.0
force-priority = "NO_PRIORITY"
max-procs = 0
pseudo-estimate-ratio = 0.8
query-feedback-limit = 1024
run-auto-analyze = true
stats-lease = "3s"
stmt-count-limit = 5000
tcp-keep-alive = true

[pessimistic-txn]
enable = true
max-retry-count = 256
ttl = "30s"

[prepared-plan-cache]
capacity = 100
enabled = false
memory-guard-ratio = 0.1

[proxy-protocol]
header-timeout = 5
networks = ""

[security]
cluster-ssl-ca = ""
cluster-ssl-cert = ""
cluster-ssl-key = ""
ssl-ca = ""
ssl-cert = ""
ssl-key = ""

[status]
report-status = true

[tikv-client]
commit-timeout = "41s"
grpc-connection-count = 16
grpc-keepalive-time = 10
grpc-keepalive-timeout = 3

[txn-local-latches]
capacity = 2048000
enabled = false

tidb_stderr.log (3.7 MB)

这个进程 Main PID: 32564
ps能看到吗?

另外你可以看下bin的同级目录是不是有个bak文件夹(升级前的版本号)
类似我这个:

尝试把bin备份下,把old的挪回去看看能不能正常启动?

ps -ef | grep 32564

tidb      32564      1  0 09:09 ?        00:00:14 bin/tidb-server -P 3306 --status=10080 --host=0.0.0.0 --advertise-address=10.10.5.28 --store=tikv --initialize-insecure --path=10.10.5.29:2379,10.10.5.28:2379,10.10.5.33:2379 --log-slow-query=/data1/deploy/log/tidb_slow_query.log --config=conf/tidb.toml --log-file=/data1/deploy/log/tidb.log

恢复bin,再启动的时候报错了

[2023/06/06 09:38:57.404 +08:00] [INFO] [systime_mon.go:26] ["start system time monitor"]
[2023/06/06 09:38:57.404 +08:00] [INFO] [store.go:75] ["new store"] [path=tikv://10.10.5.29:2379,10.10.5.28:2379,10.10.5.33:2379]
[2023/06/06 09:38:57.404 +08:00] [INFO] [client.go:405] ["[pd] create pd client with endpoints"] [pd-address="[10.10.5.29:2379,10.10.5.28:2379,10.10.5.33:2379]"]
[2023/06/06 09:38:57.411 +08:00] [INFO] [base_client.go:360] ["[pd] update member urls"] [old-urls="[http://10.10.5.29:2379,http://10.10.5.28:2379,http://10.10.5.33:2379]"] [new-urls="[http://10.10.5.28:2379,http://10.10.5.29:2379,http://10.10.5.33:2379]"]
[2023/06/06 09:38:57.411 +08:00] [INFO] [base_client.go:378] ["[pd] switch leader"] [new-leader=http://10.10.5.29:2379] [old-leader=]
[2023/06/06 09:38:57.411 +08:00] [INFO] [base_client.go:105] ["[pd] init cluster id"] [cluster-id=6708518892049401148]
[2023/06/06 09:38:57.412 +08:00] [INFO] [client.go:698] ["[pd] tso dispatcher created"] [dc-location=global]
[2023/06/06 09:38:57.413 +08:00] [INFO] [store.go:81] ["new store with retry success"]
[2023/06/06 09:38:57.427 +08:00] [INFO] [ddl_api.go:1039] ["Automatically convert BLOB(65535) to MEDIUMBLOB"]
[2023/06/06 09:38:57.429 +08:00] [FATAL] [terror.go:300] ["unexpected error"] [error="[meta:1050]table already exists"] [stack="github.com/pingcap/tidb/parser/terror.MustNil\n\t/home/jenkins/agent/workspace/build-common/go/src/github.com/pingcap/tidb/parser/terror/terror.go:300\nmain.createStoreAndDomain\n\t/home/jenkins/agent/workspace/build-common/go/src/github.com/pingcap/tidb/tidb-server/main.go:319\nmain.main\n\t/home/jenkins/agent/workspace/build-common/go/src/github.com/pingcap/tidb/tidb-server/main.go:218\nruntime.main\n\t/usr/local/go/src/runtime/proc.go:250"] [stack="github.com/pingcap/tidb/parser/terror.MustNil\n\t/home/jenkins/agent/workspace/build-common/go/src/github.com/pingcap/tidb/parser/terror/terror.go:300\nmain.createStoreAndDomain\n\t/home/jenkins/agent/workspace/build-common/go/src/github.com/pingcap/tidb/tidb-server/main.go:319\nmain.main\n\t/home/jenkins/agent/workspace/build-common/go/src/github.com/pingcap/tidb/tidb-server/main.go:218\nruntime.main\n\t/usr/local/go/src/runtime/proc.go:250"]

config file conf/tidb.toml contained invalid configuration options: enable-streaming, lower-case-table-names, log.file.log-rotate, performance.feedback-probability, performance.query-feedback-limit, pessimistic-txn.enable, pessimistic-txn.ttl, txn-local-latches, txn-local-latches.capacity, txn-local-latches.enabled; check TiDB manual to make sure this option has not been deprecated and removed from your TiDB version if the option does not appear to be a typo
env: bin/tidb-server: No such file or directory
flag provided but not defined: -initialize-insecure

看了log,应该是这个原因,你用了一些已经过期的参数。你先修改下,把不支持的参数去掉。

用tiup 修改,别直接改配置文件哦。


https://docs.pingcap.com/zh/tidb/stable/upgrade-tidb-using-tiup#23-编辑-tiup-cluster-拓扑配置文件

升级的时候有一步要修改配置文件的,我看你的配置文件加了很多参数,估计没仔细看哪些不兼容。 :joy:

这是我的配置,里面没这些配置项,不知道这些配置从哪里过来的
/home/tidb/.tiup/storage/cluster/clusters/tidb-cluster/meta.yaml

user: tidb
tidb_version: v7.1.0
last_ops_ver: |-
  v1.0.8 tiup
  Go Version: go1.13
  Git Branch: master
  GitHash: 4276089
topology:
  global:
    user: tidb
    ssh_port: 22
    ssh_type: builtin
    deploy_dir: deploy
    data_dir: data
    os: linux
    arch: amd64
  monitored:
    node_exporter_port: 9100
    blackbox_exporter_port: 9115
    deploy_dir: deploy/monitor-9100
    data_dir: data/monitor-9100
    log_dir: deploy/monitor-9100/log
  server_configs:
    tidb:
      performance.feedback-probability: 0.0
    tikv: {}
    pd: {}
    tidb_dashboard: {}
    tiflash: {}
    tiflash-learner: {}
    pump: {}
    drainer: {}
    cdc: {}
    kvcdc: {}
    grafana: {}
  tidb_servers:
  - host: 10.10.5.28
    ssh_port: 22
    imported: true
    port: 3306
    status_port: 10080
    deploy_dir: /data1/deploy
    log_dir: /data1/deploy/log
    arch: amd64
    os: linux
  - host: 10.10.5.29
    ssh_port: 22
    imported: true
    port: 4000
    status_port: 10080
    deploy_dir: /data1/deploy
    log_dir: /data1/deploy/log
    arch: amd64
    os: linux
  tikv_servers:
  - host: 10.10.5.30
    ssh_port: 22
    imported: true
    port: 20160
    status_port: 20180
    deploy_dir: /data1/deploy
    data_dir: /data1/deploy/data
    log_dir: /data1/deploy/log
    arch: amd64
    os: linux
  - host: 10.10.5.31
    ssh_port: 22
    imported: true
    port: 20160
    status_port: 20180
    deploy_dir: /data1/deploy
    data_dir: /data1/deploy/data
    log_dir: /data1/deploy/log
    arch: amd64
    os: linux
  - host: 10.10.5.32
    ssh_port: 22
    imported: true
    port: 20160
    status_port: 20180
    deploy_dir: /data1/deploy
    data_dir: /data1/deploy/data
    log_dir: /data1/deploy/log
    arch: amd64
    os: linux
  tiflash_servers:
  - host: 10.10.5.30
    ssh_port: 22
    tcp_port: 9000
    http_port: 8123
    flash_service_port: 3930
    flash_proxy_port: 20170
    flash_proxy_status_port: 20292
    metrics_port: 8234
    deploy_dir: /data1/tiflash-9000
    data_dir: data
    log_dir: log
    arch: amd64
    os: linux
  - host: 10.10.5.31
    ssh_port: 22
    tcp_port: 9000
    http_port: 8123
    flash_service_port: 3930
    flash_proxy_port: 20170
    flash_proxy_status_port: 20292
    metrics_port: 8234
    deploy_dir: /data1/tiflash-9000
    data_dir: data
    log_dir: log
    arch: amd64
    os: linux
  - host: 10.10.5.32
    ssh_port: 22
    tcp_port: 9000
    http_port: 8123
    flash_service_port: 3930
    flash_proxy_port: 20170
    flash_proxy_status_port: 20292
    metrics_port: 8234
    deploy_dir: /data1/tiflash-9000
    data_dir: data
    log_dir: log
    arch: amd64
    os: linux
  pd_servers:
  - host: 10.10.5.29
    ssh_port: 22
    imported: true
    name: pd_tipd-1
    client_port: 2379
    peer_port: 2380
    deploy_dir: /data1/deploy
    data_dir: /data1/deploy/data.pd
    log_dir: /data1/deploy/log
    arch: amd64
    os: linux
  - host: 10.10.5.28
    ssh_port: 22
    imported: true
    name: pd_tidb-1
    client_port: 2379
    peer_port: 2380
    deploy_dir: /data1/deploy
    data_dir: /data1/deploy/data.pd
    log_dir: /data1/deploy/log
    arch: amd64
    os: linux
  - host: 10.10.5.33
    ssh_port: 22
    imported: true
    name: pd_tipd-2
    client_port: 2379
    peer_port: 2380
    deploy_dir: /data1/deploy
    data_dir: /data1/deploy/data.pd
    log_dir: /data1/deploy/log
    arch: amd64
    os: linux
  monitoring_servers:
  - host: 10.10.5.28
    ssh_port: 22
    imported: true
    port: 9090
    ng_port: 12020
    deploy_dir: /data1/deploy
    data_dir: /data1/deploy/prometheus2.0.0.data.metrics
    log_dir: /data1/deploy/log
    external_alertmanagers: []
    storage_retention: 30d
    arch: amd64
    os: linux
  grafana_servers:
  - host: 10.10.5.28
    ssh_port: 22
    imported: true
    port: 3000
    deploy_dir: /data1/deploy
    arch: amd64
    os: linux
    username: admin
    password: admin
    anonymous_enable: false
    root_url: ""
    domain: ""
  alertmanager_servers:
  - host: 10.10.5.28
    ssh_port: 22
    imported: true
    web_port: 9093
    cluster_port: 9094
    deploy_dir: /data1/deploy
    data_dir: /data1/deploy/data.alertmanager
    log_dir: /data1/deploy/log
    arch: amd64
    os: linux