【 TiDB 使用环境】测试
【 TiDB 版本】6.5.1
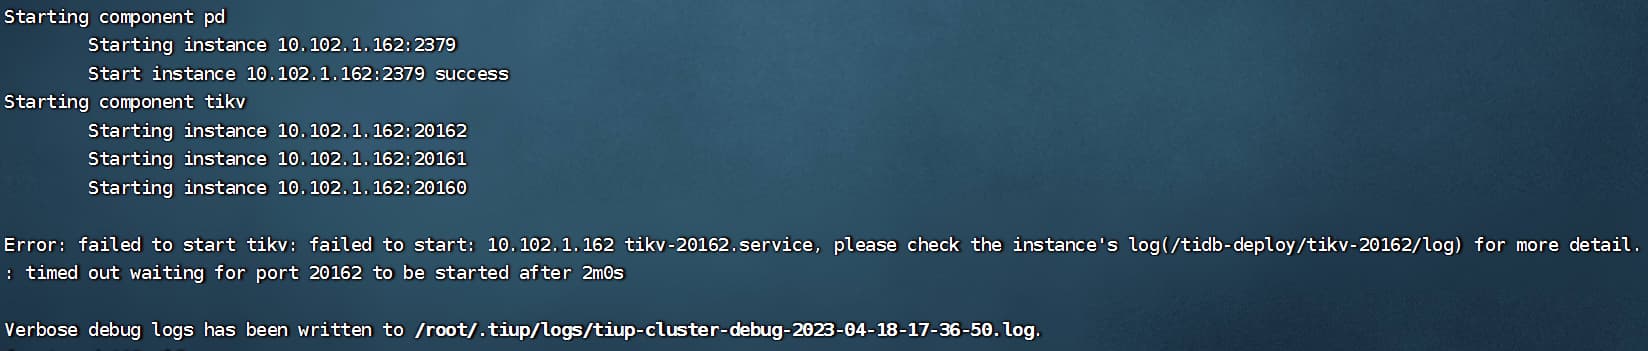
【复现路径】安装集群失败
【遇到的问题:问题现象及影响】
【资源配置】
【附件:截图/日志/监控】
task": “StartCluster”, “error”: “failed to start tikv: failed to start: 10.102.1.162 tikv-20160.service, please check the instance’s log(/tidb-deploy/tikv-20160/log) for more detail.: timed out waiting for port 20160 to be started after 2m0s”, “errorVerbose”: “timed out waiting for port 20160 to be started after 2m0s\ngithub.com/pingcap/tiup/pkg/cluster/module.(*WaitFor).Execute\n\tgithub.com/pingcap/tiup/pkg/cluster/module/wait_for.go:91\ngithub.com/pingcap/tiup/pkg/cluster/spec.PortStarted\n\tgithub.com/pingcap/tiup/pkg/cluster/spec/instance.go:121\ngithub.com/pingcap/tiup/pkg/cluster/spec.(*BaseInstance).Ready\n\tgithub.com/pingcap/tiup/pkg/cluster/spec/instance.go:154\ngithub.com/pingcap/tiup/pkg/cluster/operation.startInstance\n\tgithub.com/pingcap/tiup/pkg/cluster/operation/action.go:405\ngithub.com/pingcap/tiup/pkg/cluster/operation.StartComponent.func1\n\tgithub.com/pingcap/tiup/pkg/cluster/operation/action.go:534\ngolang.org/x/sync/errgroup.(*Group).Go.func1\n\tgolang.org/x/sync@v0.1.0/errgroup/errgroup.go:75\nruntime.goexit\n\truntime/asm_amd64.s:1594\nfailed to start: 10.102.1.162 tikv-20160.service, please check the instance’s log(/tidb-deploy/tikv-20160/log) for more detail.\nfailed to start tikv”}
2023-04-18T17:04:25.856+0800 INFO Execute command finished {“code”: 1, “error”: “failed to start tikv: failed to start: 10.102.1.162 tikv-20160.service, please check the instance’s log(/tidb-deploy/tikv-20160/log) for more detail.: timed out waiting for port 20160 to be started after 2m0s”, “errorVerbose”: “timed out waiting for port 20160 to be started after 2m0s\ngithub.com/pingcap/tiup/pkg/cluster/module.(*WaitFor).Execute\n\tgithub.com/pingcap/tiup/pkg/cluster/module/wait_for.go:91\ngithub.com/pingcap/tiup/pkg/cluster/spec.PortStarted\n\tgithub.com/pingcap/tiup/pkg/cluster/spec/instance.go:121\ngithub.com/pingcap/tiup/pkg/cluster/spec.(*BaseInstance).Ready\n\tgithub.com/pingcap/tiup/pkg/cluster/spec/instance.go:154\ngithub.com/pingcap/tiup/pkg/cluster/operation.startInstance\n\tgithub.com/pingcap/tiup/pkg/cluster/operation/action.go:405\ngithub.com/pingcap/tiup/pkg/cluster/operation.StartComponent.func1\n\tgithub.com/pingcap/tiup/pkg/cluster/operation/action.go:534\ngolang.org/x/sync/errgroup.(*Group).Go.func1\n\tgolang.org/x/sync@v0.1.0/errgroup/errgroup.go:75\nruntime.goexit\n\truntime/asm_amd64.s:1594\nfailed to start: 10.102.1.162 tikv-20160.service, please check the instance’s log(/tidb-deploy/tikv-20160/log) for more detail.\nfailed to start tikv”}
# Global variables are applied to all deployments and used as the default value of
# the deployments if a specific deployment value is missing.
global:
user: “tidb”
ssh_port: 22
deploy_dir: “/tidb-deploy”
data_dir: “/tidb-data”
# Monitored variables are applied to all the machines.
monitored:
node_exporter_port: 9100
blackbox_exporter_port: 9115
server_configs:
tidb:
log.slow-threshold: 300
tikv:
readpool.storage.use-unified-pool: false
readpool.coprocessor.use-unified-pool: true
pd:
replication.enable-placement-rules: true
replication.location-labels: [“host”]
tiflash:
logger.level: “info”
pd_servers:
- host: 10.102.1.162
tidb_servers:
- host: 10.102.1.162
tikv_servers:
-
host: 10.102.1.162
port: 20160
status_port: 20180
config:
server.labels: { host: “logic-host-1” } -
host: 10.102.1.162
port: 20161
status_port: 20181
config:
server.labels: { host: “logic-host-2” } -
host: 10.102.1.162
port: 20162
status_port: 20182
config:
server.labels: { host: “logic-host-3” }
tiflash_servers:
- host: 10.102.1.162
monitoring_servers:
- host: 10.102.1.162
grafana_servers:
- host: 10.102.1.162