【 TiDB 使用环境】生产环境
【 TiDB 版本】v6.5.0
【遇到的问题:问题现象及影响】
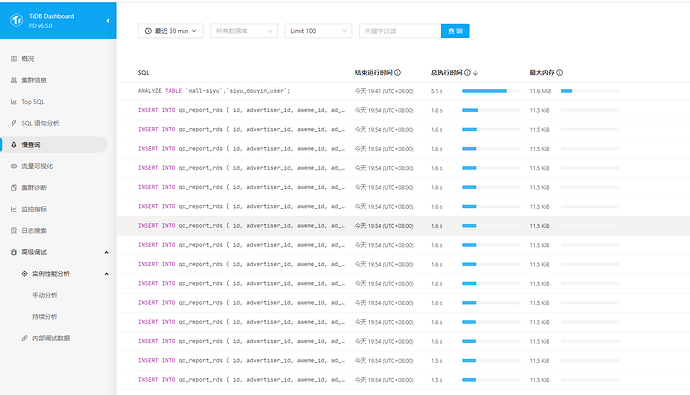
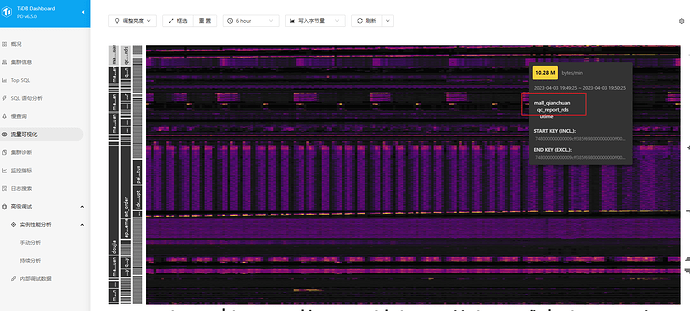
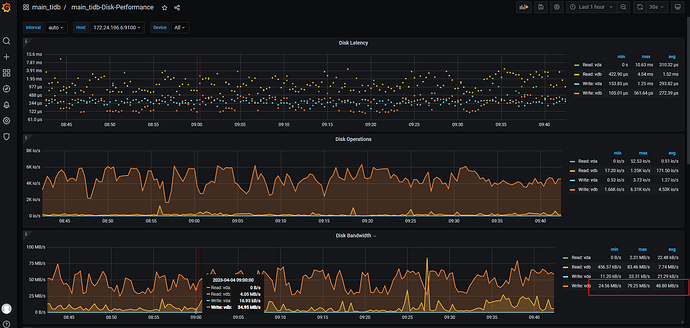
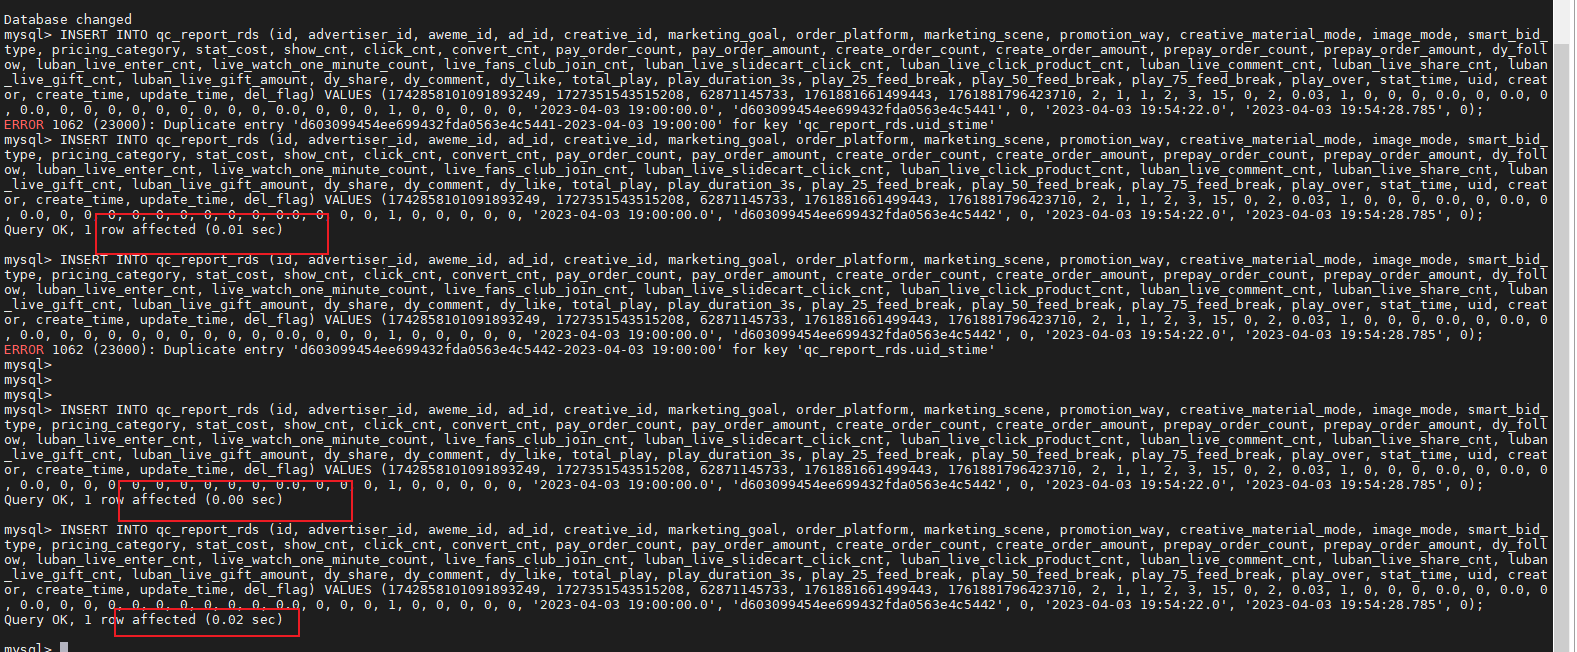
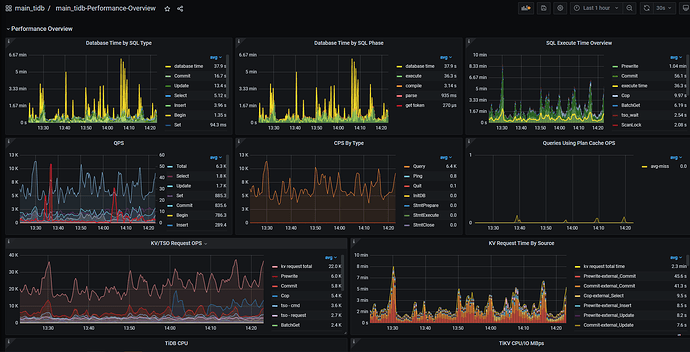
生产环境的一个表,写入很慢,大批量的insert 慢查询,甚至1s + ,服务器无压力,无明显写热点
sql语句:
INSERT INTO qc_report_rds (id, advertiser_id, aweme_id, ad_id, creative_id, marketing_goal, order_platform, marketing_scene, promotion_way, creative_material_mode, image_mode, smart_bid_type, pricing_category, stat_cost, show_cnt, click_cnt, convert_cnt, pay_order_count, pay_order_amount, create_order_count, create_order_amount, prepay_order_count, prepay_order_amount, dy_follow, luban_live_enter_cnt, live_watch_one_minute_count, live_fans_club_join_cnt, luban_live_slidecart_click_cnt, luban_live_click_product_cnt, luban_live_comment_cnt, luban_live_share_cnt, luban_live_gift_cnt, luban_live_gift_amount, dy_share, dy_comment, dy_like, total_play, play_duration_3s, play_25_feed_break, play_50_feed_break, play_75_feed_break, play_over, stat_time, uid, creator, create_time, update_time, del_flag) VALUES (1642858101091893249, 1758606025911374, 62871145733, 1761881661499443, 1761881796423710, 2, 1, 1, 2, 3, 15, 0, 2, 0.03, 1, 0, 0, 0, 0.0, 0, 0.0, 0, 0.0, 0, 0, 0, 0, 0, 0, 0, 0, 0, 0.0, 0, 0, 0, 1, 0, 0, 0, 0, 0, '2023-04-03 19:00:00.0', 'd603099454ee699432fda0563e4c5441', 0, '2023-04-03 19:54:22.0', '2023-04-03 19:54:28.785', 0);
执行计划:
	id      	task	estRows	operator info	actRows	execution info                                                                                                                                                                                                                                                                                                                                                                                                                                                                                                                                                                                                                                                                                                                                                                                                                                                                                                                                                                                                                                                                                                                                                                                                                                                                                                                                                                                                                                                                                                                                                                                                                                                                                                                                                                                                                                                                                                 	memory 	disk
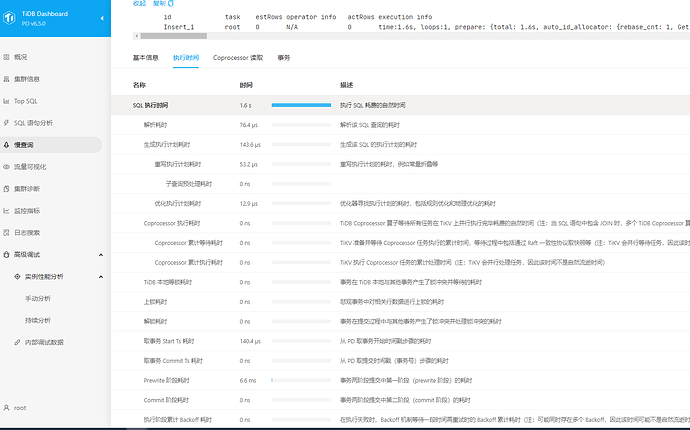
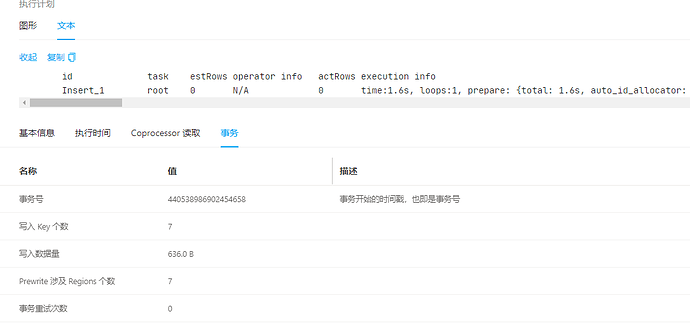
	Insert_1	root	0      	N/A          	0      	time:1.6s, loops:1, prepare: {total: 1.6s, auto_id_allocator: {rebase_cnt: 1, Get:{num_rpc:4, total_time:1.51ms}, commit_txn: {prewrite:5.79ms, get_commit_ts:1.43ms, commit:3.71ms, slowest_prewrite_rpc: {total: 0.006s, region_id: 241596, store: 172.24.196.8:20160, tikv_wall_time: 4.2ms, scan_detail: {get_snapshot_time: 6.17µs, rocksdb: {block: {cache_hit_count: 13}}}, write_detail: {store_batch_wait: 110.9µs, propose_send_wait: 0s, persist_log: {total: 847.2µs, write_leader_wait: 96.9µs, sync_log: 664.4µs, write_memtable: 4.4µs}, commit_log: 3.75ms, apply_batch_wait: 13.1µs, apply: {total:104.9µs, mutex_lock: 0s, write_leader_wait: 0s, write_wal: 13.1µs, write_memtable: 42.7µs}}}, commit_primary_rpc: {total: 0.004s, region_id: 241596, store: 172.24.196.8:20160, tikv_wall_time: 3.4ms, scan_detail: {get_snapshot_time: 4.61µs, rocksdb: {block: {}}}, write_detail: {store_batch_wait: 868µs, propose_send_wait: 0s, persist_log: {total: 261.9µs, write_leader_wait: 95ns, sync_log: 230.5µs, write_memtable: 1.99µs}, commit_log: 2.38ms, apply_batch_wait: 15.9µs, apply: {total:44.1µs, mutex_lock: 0s, write_leader_wait: 0s, write_wal: 15.9µs, write_memtable: 18.2µs}}}, region_num:1, write_keys:1, write_byte:55}}}, insert:108µs, commit_txn: {prewrite:6.62ms, slowest_prewrite_rpc: {total: 0.007s, region_id: 332115, store: 172.24.196.8:20160, tikv_wall_time: 5.85ms, scan_detail: {get_snapshot_time: 96.5µs, rocksdb: {block: {cache_hit_count: 9}}}, write_detail: {store_batch_wait: 1.75ms, propose_send_wait: 0s, persist_log: {total: 1.4ms, write_leader_wait: 167ns, sync_log: 766.5µs, write_memtable: 28.9µs}, commit_log: 3.6ms, apply_batch_wait: 59.9µs, apply: {total:102.2µs, mutex_lock: 0s, write_leader_wait: 0s, write_wal: 59.9µs, write_memtable: 53.3µs}}}, region_num:7, write_keys:7, write_byte:636}	3.50 KB	N/A
【资源配置】
表结构:
有5个普通索引,1个联合唯一索引
【附件:截图/日志/监控】
