【 TiDB 使用环境】生产环境 /测试/ Poc
【 TiDB 版本】
【复现路径】把监控组件从一台机器迁移到另外一台机器
【遇到的问题:监控显示异常,本来pd是leader,显示为follower,还有好多数据显示不出来了】
【资源配置】
【附件:截图/日志/监控】
迁移前显示内容

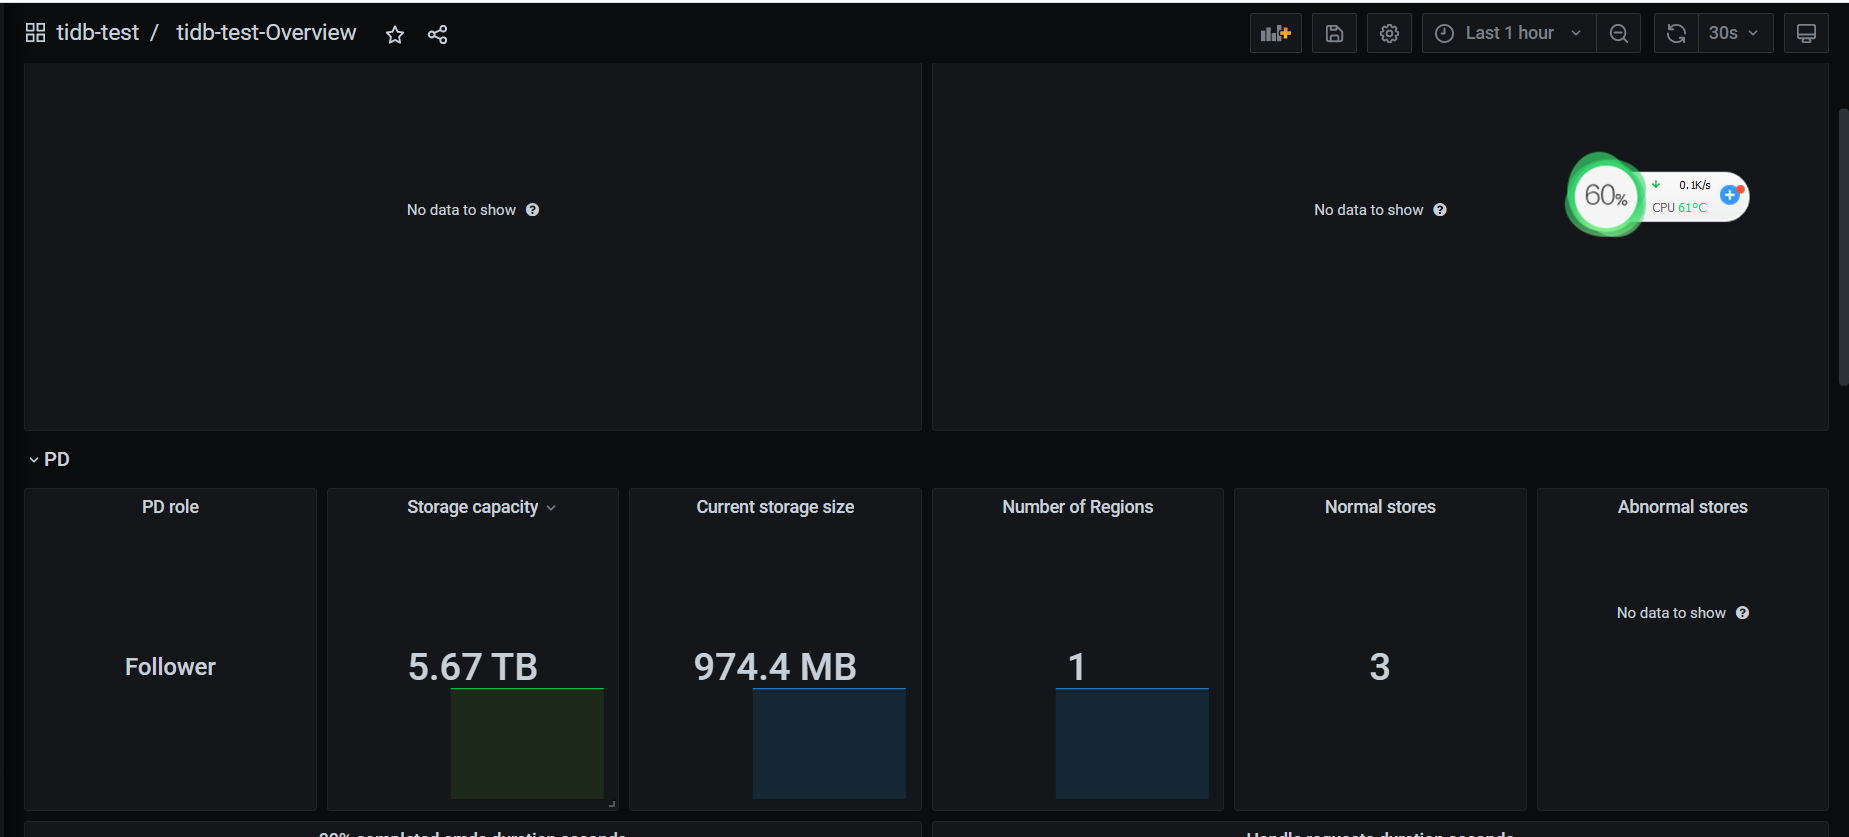
迁移后显示内容
【 TiDB 使用环境】生产环境 /测试/ Poc
【 TiDB 版本】
【复现路径】把监控组件从一台机器迁移到另外一台机器
【遇到的问题:监控显示异常,本来pd是leader,显示为follower,还有好多数据显示不出来了】
【资源配置】
【附件:截图/日志/监控】
迁移前显示内容
是不是原来部署的 各个节点实例服务,之前的对接信息还没做 变更
建议直接缩容掉原来的prometheus,重新在扩容一套,这样更简单
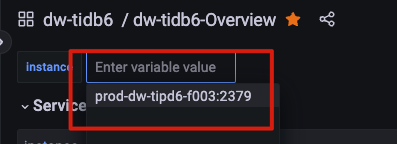
看一下在最上面的地方,这里是不是两个或者更多的tipd实例。有一些tipd相关的监控面板是和tipd实例打通的,切换后两个tipd实例都只能覆盖一部分时间范围。不过TiDB和TiKV哪些面板应该不受影响
就是这样操作的,部分信息能显示,部分信息显示,还有部分显示不正确,操作过程如下:
tiup cluster display tidb-test
tiup cluster show-config tidb-test
tiup cluster display tidb-test
tiup cluster scale-in tidb-test -N 10.26.109.98:9093,10.26.109.98:3000
tiup cluster display tidb-test
tiup cluster check ./single-monitor.yaml --user root -p
tiup cluster check --help
tiup cluster check --cluster tidb-test ./single-monitor.yaml --user
tiup cluster scale-out tidb-test single-monitor.yaml --user root -p
操作显示是成功的,就是显示内容缺少了,和pd 本来是leader 却显示为follower
额,你这是直接把prometheus给缩容了啊,那之前的数据肯定是被删除了。。
我都试了,选择leader-pd端口对应的那个选项也是显示为follower
监控组件怎么迁移的?
prometheus数据迁移了吗?
嗯嗯,现在如开始图,部分信息显示不出来,pd leader 显示为follower
没有迁移,直接缩容,扩容,看上面命令,是相关过程,没有备份历史数据
用pd-ctl看下PD现在leader是谁吧
tiup ctl:v6.5.0 pd member
Starting component ctl: /home/tidb/.tiup/components/ctl/v6.5.0/ctl pd --pd 10.26.109.99:2379 member
{
“header”: {
“cluster_id”: 7204711972043972961
},
“members”: [
{
“name”: “pd-10.26.109.99-2379”,
“member_id”: 3748938598193133207,
“peer_urls”: [
“http://10.26.109.99:2380”
],
“client_urls”: [
“http://10.26.109.99:2379”
],
“deploy_path”: “/export/tidb-deploy/pd-2379/bin”,
“binary_version”: “v6.5.0”,
“git_hash”: “d1a4433c3126c77fb2d5bb5720eefa0f2e05c166”
},
{
“name”: “pd-10.26.109.98-2379”,
“member_id”: 7744517254921949623,
“peer_urls”: [
“http://10.26.109.98:2380”
],
“client_urls”: [
“http://10.26.109.98:2379”
],
“deploy_path”: “/export/tidb-deploy/pd-2379/bin”,
“binary_version”: “v6.5.0”,
“git_hash”: “d1a4433c3126c77fb2d5bb5720eefa0f2e05c166”
},
{
“name”: “pd-10.26.109.97-2379”,
“member_id”: 12410221973370163989,
“peer_urls”: [
“http://10.26.109.97:2380”
],
“client_urls”: [
“http://10.26.109.97:2379”
],
“deploy_path”: “/export/tidb-deploy/pd-2379/bin”,
“binary_version”: “v6.5.0”,
“git_hash”: “d1a4433c3126c77fb2d5bb5720eefa0f2e05c166”
}
],
“leader”: {
“name”: “pd-10.26.109.99-2379”,
“member_id”: 3748938598193133207,
“peer_urls”: [
“http://10.26.109.99:2380”
],
“client_urls”: [
“http://10.26.109.99:2379”
],
“deploy_path”: “/export/tidb-deploy/pd-2379/bin”,
“binary_version”: “v6.5.0”,
“git_hash”: “d1a4433c3126c77fb2d5bb5720eefa0f2e05c166”
},
“etcd_leader”: {
“name”: “pd-10.26.109.99-2379”,
“member_id”: 3748938598193133207,
“peer_urls”: [
“http://10.26.109.99:2380”
],
“client_urls”: [
“http://10.26.109.99:2379”
],
“deploy_path”: “/export/tidb-deploy/pd-2379/bin”,
“binary_version”: “v6.5.0”,
“git_hash”: “d1a4433c3126c77fb2d5bb5720eefa0f2e05c166”
}
}
leader 和 display 显示的一样
display 的截图也发一下,1.升级完后有没有重启过集群,2.普罗的监控数据都删了,到ui监控上看一下新建的有没产生数据。
是不是监控数据清空了;看下普罗米修斯,刷新下grafana的DataSource试试
还是不行
把prometheus下的配置文件删除了,重启一下试试?
问题已经解决,新的监控组件所在服务器时间比正常晚了5分钟左右,时间同步正常,相关显示也正常了谢谢各位
使用时间服务器的重要性。
还和浏览器所在的主机时间有关,也要一致
与浏览器的时间有关?不是吧