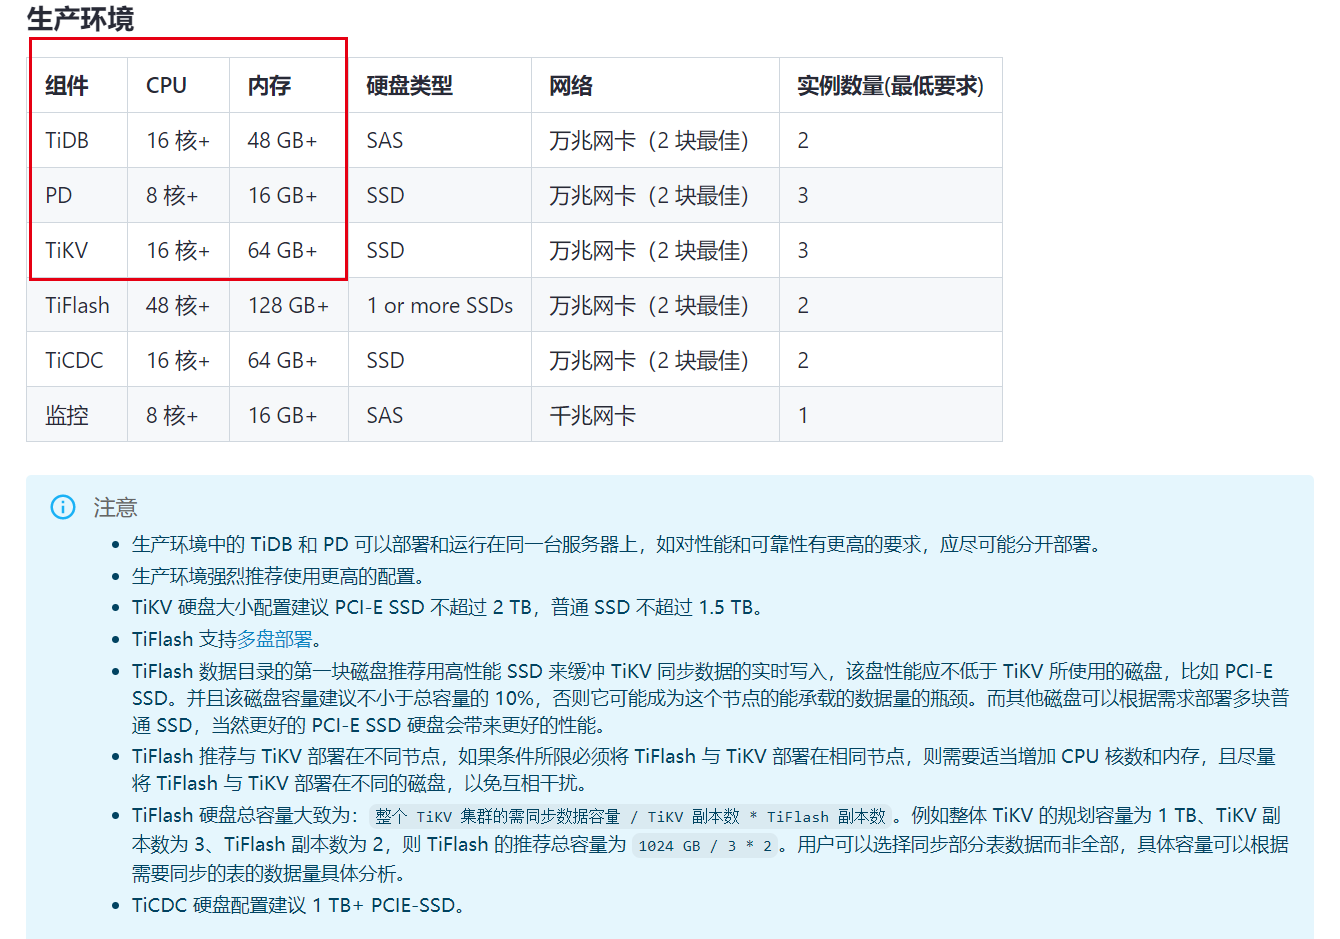
【 TiDB 使用环境】生产环境
【 TiDB 版本】
6.6.0
【复现路径】
【遇到的问题:问题现象及影响】
现公司两台8核32g的机子,一台装的tidb1个,tipd1个,另一台装的tikv3个,装tikv的机子cpu直接满了
想的是在第一台装tidb的机子上,扩容一个tikv,将另一台装tikv的机子上,缩容一个tikv,这样能解决问题吗?
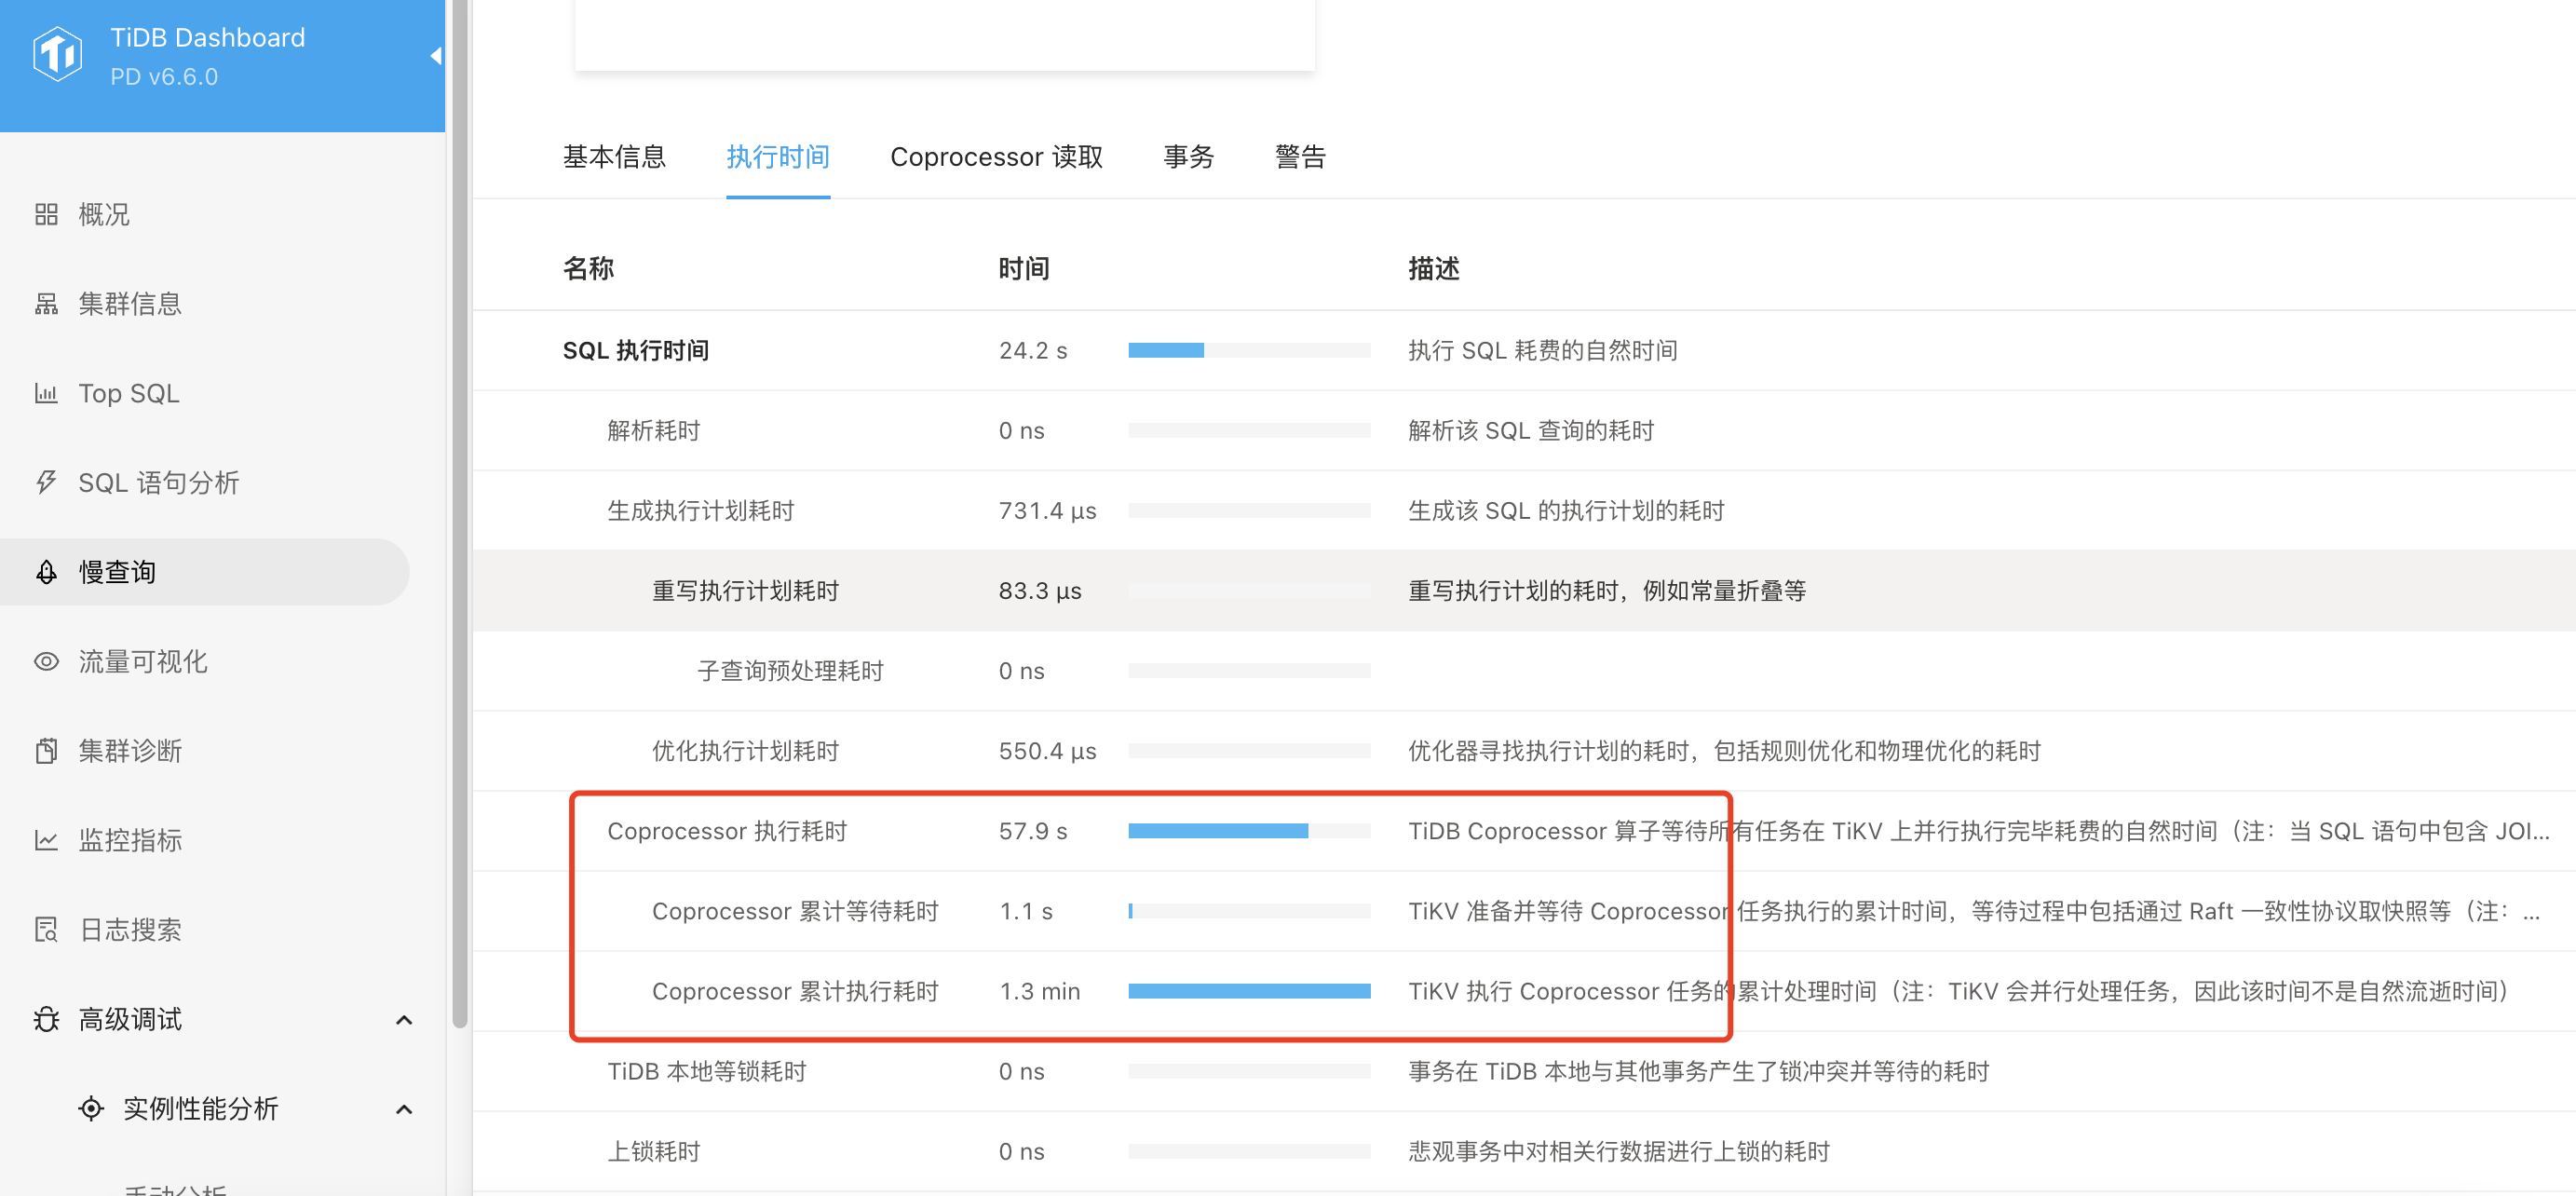
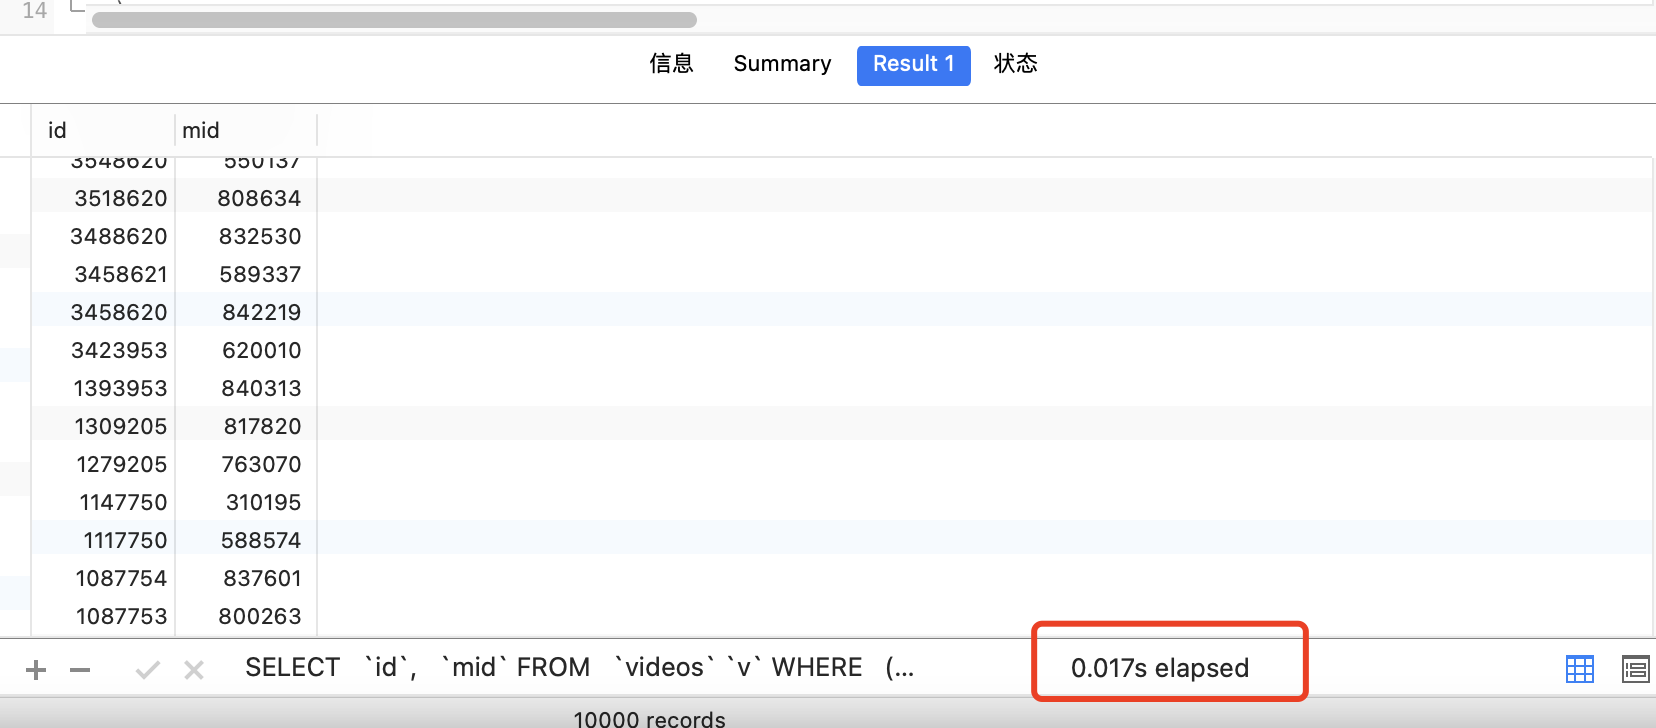
还有就是tidb总是down掉,有部分慢查询,Coprocessor 执行耗时较长,但是查看执行时间不是索引的问题,应该是服务器资源的问题
	id                            	task     	estRows	operator info                                                                                                                                                        	actRows	execution info                                                                                                                                                                                                                                                                                                                                                                                                                                                                                                                                                                                                                     	memory  	disk
	Projection_8                  	root     	0.00   	tokvideos.videos.id, tokvideos.videos.mid                                                                                                                            	10000  	time:43.5s, loops:11, Concurrency:OFF                                                                                                                                                                                                                                                                                                                                                                                                                                                                                                                                                                                              	163.4 KB	N/A
	└─Limit_14                    	root     	0.00   	offset:0, count:10000                                                                                                                                                	10000  	time:43.5s, loops:11                                                                                                                                                                                                                                                                                                                                                                                                                                                                                                                                                                                                               	N/A     	N/A
	  └─IndexLookUp_35            	root     	0.00   	                                                                                                                                                                     	10000  	time:43.5s, loops:10, index_task: {total_time: 43.5s, fetch_handle: 16.4s, build: 46.3ms, wait: 27s}, table_task: {total_time: 3m14.3s, num: 14, concurrency: 5}, next: {wait_index: 23.5ms, wait_table_lookup_build: 218.3µs, wait_table_lookup_resp: 43.5s}                                                                                                                                                                                                                                                                                                                                                                     	15.7 MB 	N/A
	    ├─IndexRangeScan_32(Build)	cop[tikv]	0.00   	table:v, index:mode_2(mode, status, ischeck, is_vip, ioscheck, createtime), range:(1 1 1 0 0 2023-02-19 12:34:15,1 1 1 0 0 +inf], keep order:true, desc, stats:pseudo	261604 	time:16.4s, loops:239, cop_task: {num: 67, max: 5.54s, min: 260.4µs, avg: 315ms, p95: 1.84s, max_proc_keys: 33760, p95_proc_keys: 17376, tot_proc: 19.3s, tot_wait: 1.53s, rpc_num: 67, rpc_time: 21.1s, copr_cache_hit_ratio: 0.49, build_task_duration: 29.7µs, max_distsql_concurrency: 2}, tikv_task:{proc max:5.39s, min:0s, avg: 385.6ms, p80:50ms, p95:1.84s, iters:506, tasks:67}, scan_detail: {total_process_keys: 195077, total_process_keys_size: 19507700, total_keys: 201402, get_snapshot_time: 589.4µs, rocksdb: {delete_skipped_count: 14345, key_skipped_count: 230087, block: {cache_hit_count: 647}}}       	N/A     	N/A
	    └─Selection_34(Probe)     	cop[tikv]	0.00   	isnull(tokvideos.videos.deletetime)                                                                                                                                  	140918 	time:3m14.3s, loops:162, cop_task: {num: 35, max: 43.5s, min: 377.9µs, avg: 3.95s, p95: 42.3s, max_proc_keys: 12104, p95_proc_keys: 10912, tot_proc: 2m14.7s, tot_wait: 3.29s, rpc_num: 35, rpc_time: 2m18.3s, copr_cache_hit_ratio: 0.26, build_task_duration: 2.6ms, max_distsql_concurrency: 5}, tikv_task:{proc max:42.8s, min:9ms, avg: 3.94s, p80:4.53s, p95:42.2s, iters:287, tasks:35}, scan_detail: {total_process_keys: 136239, total_process_keys_size: 53236007, total_keys: 211480, get_snapshot_time: 451.6µs, rocksdb: {delete_skipped_count: 45724, key_skipped_count: 296550, block: {cache_hit_count: 490074}}}	N/A     	N/A
	      └─TableRowIDScan_33     	cop[tikv]	0.00   	table:v, keep order:false, stats:pseudo                                                                                                                              	140918 	tikv_task:{proc max:42.8s, min:9ms, avg: 3.94s, p80:4.53s, p95:42.2s, iters:287, tasks:35}                                                                                                                                                                                                                                                                                                                                                                                                                                                                                                                                         	N/A     	N/A
部署脚本如下
# 全局变量应用于所有部署,如果缺少特定的部署值,则将其用作部署的默认值。
global:
  # 运行tidb集群的用户.
  user: "tidb"
  # Group用于指定用户所属的组名(如果与user不相同)
  # group: "tidb"
  # 所管理集群服务器的SSH端口.
  ssh_port: 22
  # 集群部署文件、启动脚本、配置文件的存放路径。
  deploy_dir: "/tidb/tidb-deploy"
  # TiDB集群数据存储目录
  data_dir: "/tidb/tidb-data"
  # 支持值:amd64、arm64(默认值:amd64)
  arch: "amd64"
  # 资源控制用于限制实例的资源。
  # See: https://www.freedesktop.org/software/systemd/man/systemd.resource-control.html
  # 支持使用实例级的“resource_control”覆盖全局的“resource_control”。
  resource_control:
  # See: https://www.freedesktop.org/software/systemd/man/systemd.resource-control.html#MemoryLimit=bytes
      # 内存限制
    memory_limit: "8G"
      # See: https://www.freedesktop.org/software/systemd/man/systemd.resource-control.html#CPUQuota=
      # 百分比指定相对于一个CPU上可用的总CPU时间,单元最多应该获得多少CPU时间。使用值> 100%在多个CPU上分配CPU时间。
      # Example: CPUQuota=200% ensures that the executed processes will never get more than two CPU time.
    cpu_quota: "400%"
      # See: https://www.freedesktop.org/software/systemd/man/systemd.resource-control.html#IOReadBandwidthMax=device%20bytes
  #   io_read_bandwidth_max: "/dev/disk/by-path/pci-0000:00:1f.2-scsi-0:0:0:0 100M"
  #   io_write_bandwidth_max: "/dev/disk/by-path/pci-0000:00:1f.2-scsi-0:0:0:0 100M"

# # 监视的变量应用于所有机器。
monitored:
  # TiDB集群中各节点上报系统信息的通信端口。
  node_exporter_port: 9100
  # blackbox_export通信端口,用于TiDB集群端口监控。
  blackbox_exporter_port: 9115
  # 监控组件部署文件、启动脚本和配置文件的存放路径.
  # deploy_dir: "/tidb-deploy/monitored-9100"
  # 监控组件的数据存放路径
  # data_dir: "/tidb-data/monitored-9100"
  # 监控组件的日志存放路径
  # log_dir: "/tidb-deploy/monitored-9100/log"

# 服务器配置用于指定TiDB组件的运行时配置
# 所有配置项都可以在TiDB文档中找到:
# - TiDB: https://pingcap.com/docs/stable/reference/configuration/tidb-server/configuration-file/
# - TiKV: https://pingcap.com/docs/stable/reference/configuration/tikv-server/configuration-file/
# - PD: https://pingcap.com/docs/stable/reference/configuration/pd-server/configuration-file/
# - TiFlash: https://docs.pingcap.com/tidb/stable/tiflash-configuration
# #
# # 所有配置项都使用点来表示层次结构, e.g:
# #   readpool.storage.use-unified-pool
# #           ^       ^
# # - example: https://github.com/pingcap/tiup/blob/master/embed/examples/cluster/topology.example.yaml
# 您可以通过实例级的' config '字段覆盖此配置。
server_configs:
  # tidb:
  tikv:
    # 是否使用统一的读取线程池处理存储请求
    readpool.storage.use-unified-pool: true
    # 是否使用统一的读取线程池(在 readpool.unified 中配置)处理协处理器请求
    readpool.coprocessor.use-unified-pool: true
    # 统一处理读请求的线程池最多的线程数量
    readpool.unified.max-thread-count: 2
    # 共享 block cache 的大小
    storage.block-cache.capacity: "3GB"
    # 存储容量,即允许的最大数据存储大小。如果没有设置,则使用当前磁盘容量。如果要将多个 TiKV 实例部署在同一块物理磁盘上,需要在 TiKV 配置中添加该参数
    raftstore.capacity: "50GB"
  pd:
    replication.enable-placement-rules: true
    replication.location-labels: ["host"]
  # tiflash:
  # tiflash-learner:
  # kvcdc:

# PD配置。
pd_servers:
  - host: 172.27.197.96
    # 服务器的SSH端口.
    # ssh_port: 22
    # PD服务器名称
    # name: "pd-1"
    # 用于连接TiDB服务器的通信端口。
    # client_port: 2379
    # PD Server节点之间的通信端口
    # peer_port: 2380
    # PD Server部署文件、启动脚本、配置文件存放目录
    # deploy_dir: "/tidb-deploy/pd-2379"
    # PD服务器数据存储目录。
    # data_dir: "/tidb-data/pd-2379"
    # PD服务器日志文件的存放目录
    # log_dir: "/tidb-deploy/pd-2379/log"
    # Numa节点绑定
    # numa_node: "0"
    # 下面的配置用于覆盖`server_configs.pd`的值.
    config:
    #   schedule.max-merge-region-size: 20
    #   schedule.max-merge-region-keys: 200000

# TiDB配置。
tidb_servers:
  - host: 172.27.197.96
    # ssh_port: 22
    # 访问TiDB集群端口
    port: 4000
    # TiDB服务器状态信息上报端口.
    status_port: 10080
    # TiDB服务器部署文件、启动脚本、配置文件存放目录。
    # deploy_dir: "/tidb-deploy/tidb-4000"
    # TiDB服务器日志文件存放路径
    # log_dir: "/tidb-deploy/tidb-4000/log"
    # 建议绑定numa节点
    # numa_node: "1"

# TiKV配置
tikv_servers:
  - host: 172.27.197.97
    port: 20160
    status_port: 20180
    # numa_node: "0"
    # 下面的配置用于覆盖server_configs.tikv
    config:
      log.level: warn
      server.labels:
        host: tikv1
  - host: 172.27.197.97
    port: 20161
    status_port: 20181
    # numa_node: "1"
    config:
      log.level: warn
      server.labels:
        host: tikv1
  - host: 172.27.197.97
    port: 20162
    status_port: 20182
    # numa_node: "0"
    config:
      log.level: warn
      server.labels:
        host: tikv1

# # 服务器配置用于指定TiFlash服务器的配置
tiflash_servers:
  # # The ip address of the TiFlash Server.
  - host: 172.27.197.97
    # tcp_port: 9000
    # http_port: 8123
    # # TiFlash raft service and coprocessor service listening address.
    # flash_service_port: 3930
    # # TiFlash Proxy service port.
    # flash_proxy_port: 20170
    # # Prometheus pulls TiFlash Proxy metrics port.
    # flash_proxy_status_port: 20292
    # # Prometheus pulls the TiFlash metrics port.
    # metrics_port: 8234

monitoring_servers:
  # # The ip address of the Monitoring Server.
  - host: 172.27.197.96

grafana_servers:
  # # The ip address of the Grafana Server.
  - host: 172.27.197.96
【资源配置】
两台8核32g的机子,一台装的tidb1个,tipd1个,另一台装的tikv3个,tiflash1个
【附件:截图/日志/监控】