我在win11 wsl环境下可以正常部署tidb单机集群,数据库也可以正常访问。最后验证Dashboard的时候提示连接拒绝。登录服务器,查看监听情况如下:
jin@TABLET-PBTEB744:~$ netstat -an | grep 2379 | grep LISTEN
tcp6 0 0 :::2379 :::* LISTEN
从监听来你看,好像是有点问题,只监听了IPV6地址。
在同样系统wsl下的playground可以正常打开Dashboard,地址监听信息如下:
jin@TABLET-PBTEB744:~$ netstat -an | grep 2379 | grep LISTEN
tcp 0 0 127.0.0.1:2379 0.0.0.0:* LISTEN
监听地址是对的,Dashboard也可以正常打开。
请各位看看有啥建议?
也请Tidb开发专家也帮忙看看。
方便说一下,wsl用的是Ubuntu的吗?集群部署完是启动成功了吗?然后部署单机 TiDB 的配置文件麻烦发出来看看
1 个赞
1、是的,集群是正常启动。启动和display信息如下:
jin@TABLET-PBTEB744:~$ tiup cluster start tidbtest
tiup is checking updates for component cluster …
Starting component cluster: /home/jin/.tiup/components/cluster/v1.11.1/tiup-cluster start tidbtest
Starting cluster tidbtest…
- [ Serial ] - SSHKeySet: privateKey=/home/jin/.tiup/storage/cluster/clusters/tidbtest/ssh/id_rsa, publicKey=/home/jin/.tiup/storage/cluster/clusters/tidbtest/ssh/id_rsa.pub
- [Parallel] - UserSSH: user=tidb, host=127.0.0.1
- [Parallel] - UserSSH: user=tidb, host=127.0.0.1
- [Parallel] - UserSSH: user=tidb, host=127.0.0.1
- [Parallel] - UserSSH: user=tidb, host=127.0.0.1
- [Parallel] - UserSSH: user=tidb, host=127.0.0.1
- [ Serial ] - StartCluster
Starting component pd
Starting instance 127.0.0.1:2379
[sudo] password for jin:
Start instance 127.0.0.1:2379 success
Starting component tikv
Starting instance 127.0.0.1:20160
Start instance 127.0.0.1:20160 success
Starting component tidb
Starting instance 127.0.0.1:4000
Start instance 127.0.0.1:4000 success
Starting component prometheus
Starting instance 127.0.0.1:9090
Start instance 127.0.0.1:9090 success
Starting component grafana
Starting instance 127.0.0.1:3000
Start instance 127.0.0.1:3000 success
Starting component node_exporter
Starting instance 127.0.0.1
Start 127.0.0.1 success
Starting component blackbox_exporter
Starting instance 127.0.0.1
Start 127.0.0.1 success - [ Serial ] - UpdateTopology: cluster=tidbtest
Started clustertidbtestsuccessfully
jin@TABLET-PBTEB744:~$ tiup cluster display tidbtest
tiup is checking updates for component cluster …
Starting componentcluster: /home/jin/.tiup/components/cluster/v1.11.1/tiup-cluster display tidbtest
Cluster type: tidb
Cluster name: tidbtest
Cluster version: v6.5.0
Deploy user: tidb
SSH type: none
Dashboard URL: http://127.0.0.1:2379/dashboard
Grafana URL: http://127.0.0.1:3000
ID Role Host Ports OS/Arch Status Data Dir Deploy Dir
127.0.0.1:3000 grafana 127.0.0.1 3000 linux/x86_64 Up - /tidb-deploy/grafana-3000
127.0.0.1:2379 pd 127.0.0.1 2379/2380 linux/x86_64 Up|L|UI /tidb-data/pd-2379 /tidb-deploy/pd-2379
127.0.0.1:9090 prometheus 127.0.0.1 9090/12020 linux/x86_64 Up /tidb-data/prometheus-9090 /tidb-deploy/prometheus-9090
127.0.0.1:4000 tidb 127.0.0.1 4000/10080 linux/x86_64 Up - /tidb-deploy/tidb-4000
127.0.0.1:20160 tikv 127.0.0.1 20160/20180 linux/x86_64 Up /tidb-data/tikv-20160 /tidb-deploy/tikv-20160
Total nodes: 5
2、配置文件如下
jin@TABLET-PBTEB744:~$ cat template.yaml
For more information about the format of the tiup cluster topology file, consult
https://docs.pingcap.com/tidb/stable/production-deployment-using-tiup#step-3-initialize-cluster-topology-file
# Global variables are applied to all deployments and used as the default value of
# the deployments if a specific deployment value is missing.
global:
# The OS user who runs the tidb cluster.
user: “tidb”
# SSH port of servers in the managed cluster.
ssh_port: 22
# Storage directory for cluster deployment files, startup scripts, and configuration files.
deploy_dir: “/tidb-deploy”
# TiDB Cluster data storage directory
data_dir: “/tidb-data”
# Supported values: “amd64”, “arm64” (default: “amd64”)
arch: “amd64”
pd_servers:
- host: 127.0.0.1
tidb_servers:
- host: 127.0.0.1
tikv_servers:
- host: 127.0.0.1
monitoring_servers:
- host: 127.0.0.1
grafana_servers:
- host: 127.0.0.1
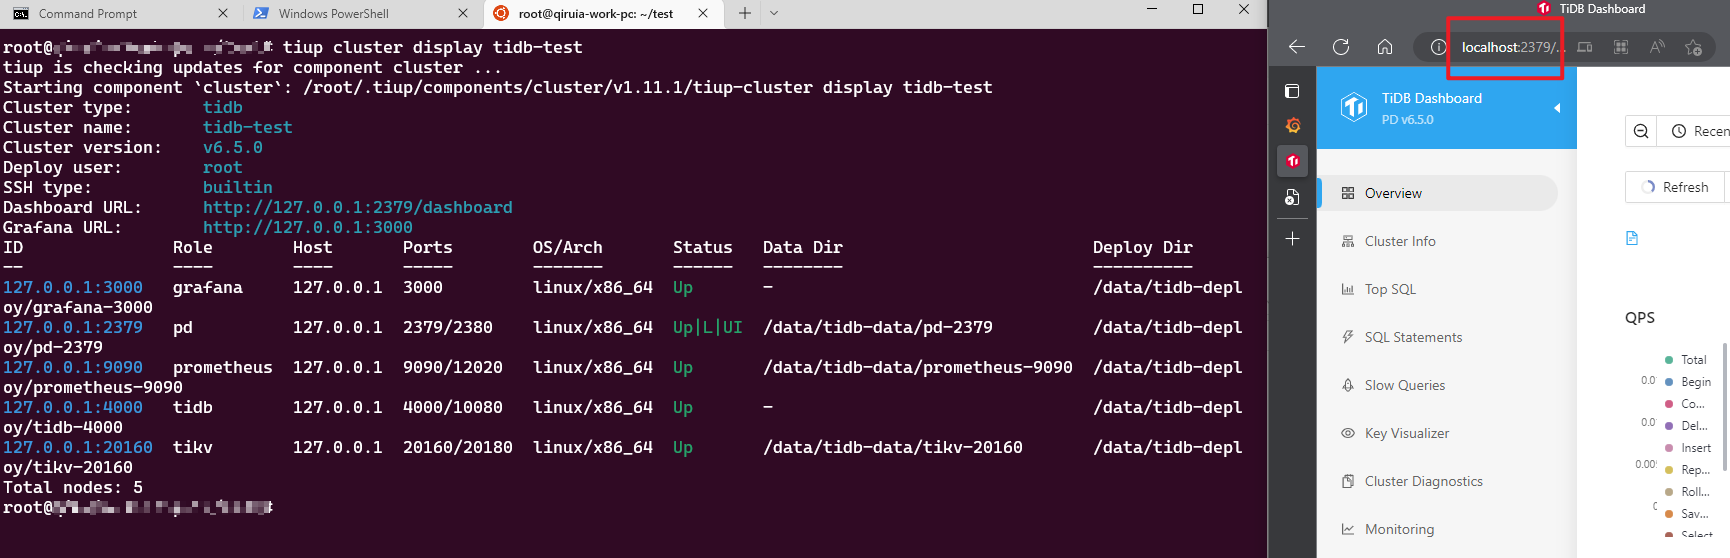
看图,这里我参照你说的,去部署了一个 tidb 集群,使用
http://127.0.0.1:2379/dashboard 的确没办法正常访问集群的dashboard,但是使用http://localhost:2379/dashboard 却可以,其实这是 WSL2 的特殊性,与WSL1不一样的是,WSL2可以视为一个独立的虚拟机、具有自己独立的IP地址,通过虚拟路由器与Windows连接。在WSL2中部署的服务在Windows中无法直接通过 127.0.0.1 进行访问、但可以通过 localhost 访问,这应该是采用了一些特殊的内部链路技术来实现的。
而 为什么 tiup playground 临时拉起来的集群却可以通过 127.0.0.1 访问,我猜想是 tiup playground 默认会指定一个 --host 127.0.0.1 ,不过不一定对。
不知道是不是可以提给tidb研发看看,根源在哪里。
此话题已在最后回复的 60 天后被自动关闭。不再允许新回复。