为提高效率,请提供以下信息,问题描述清晰能够更快得到解决:
【 TiDB 使用环境】
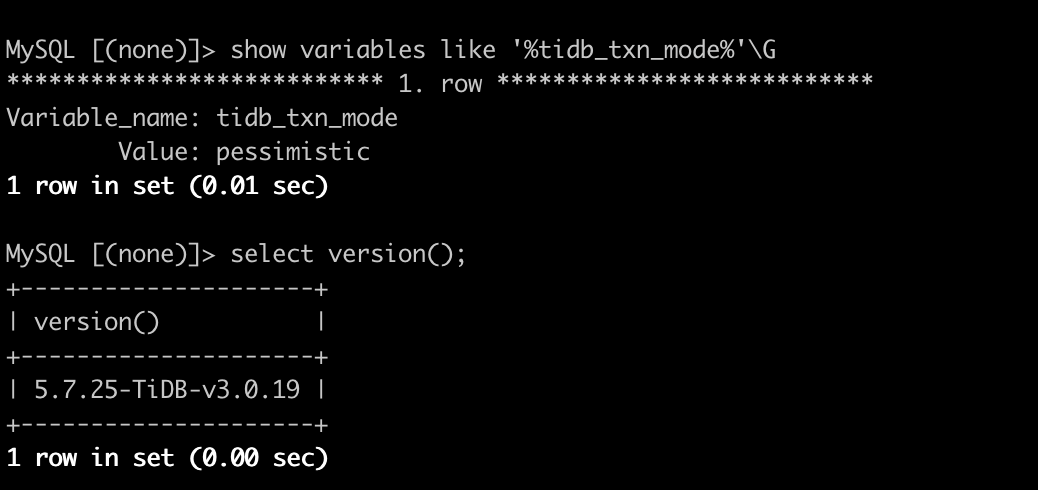
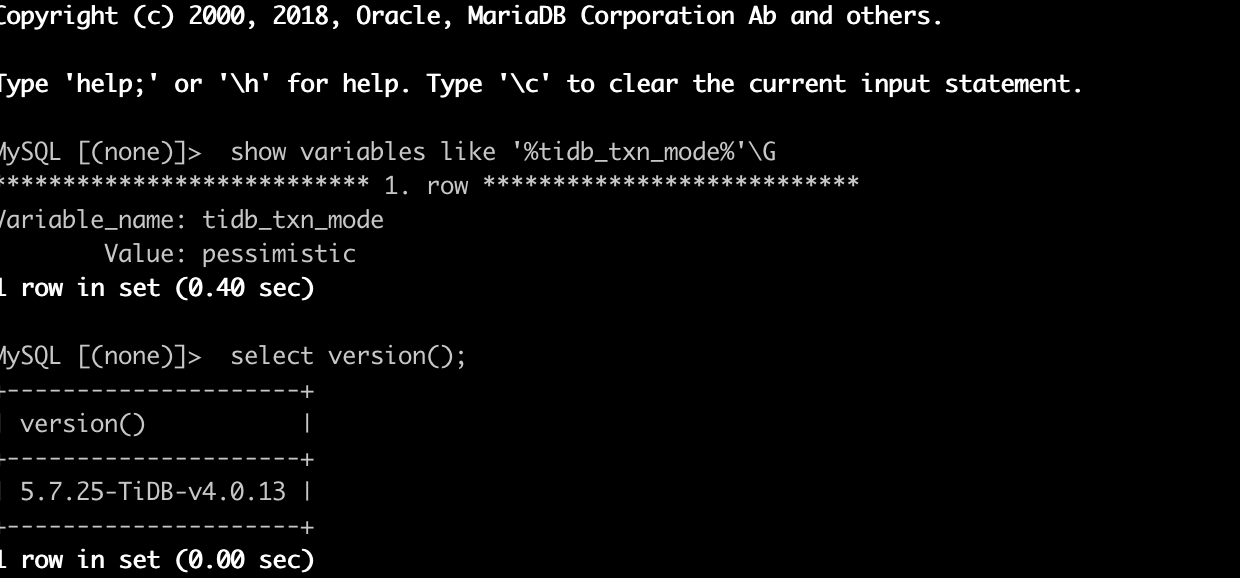
生产测试环境,V4.0.13
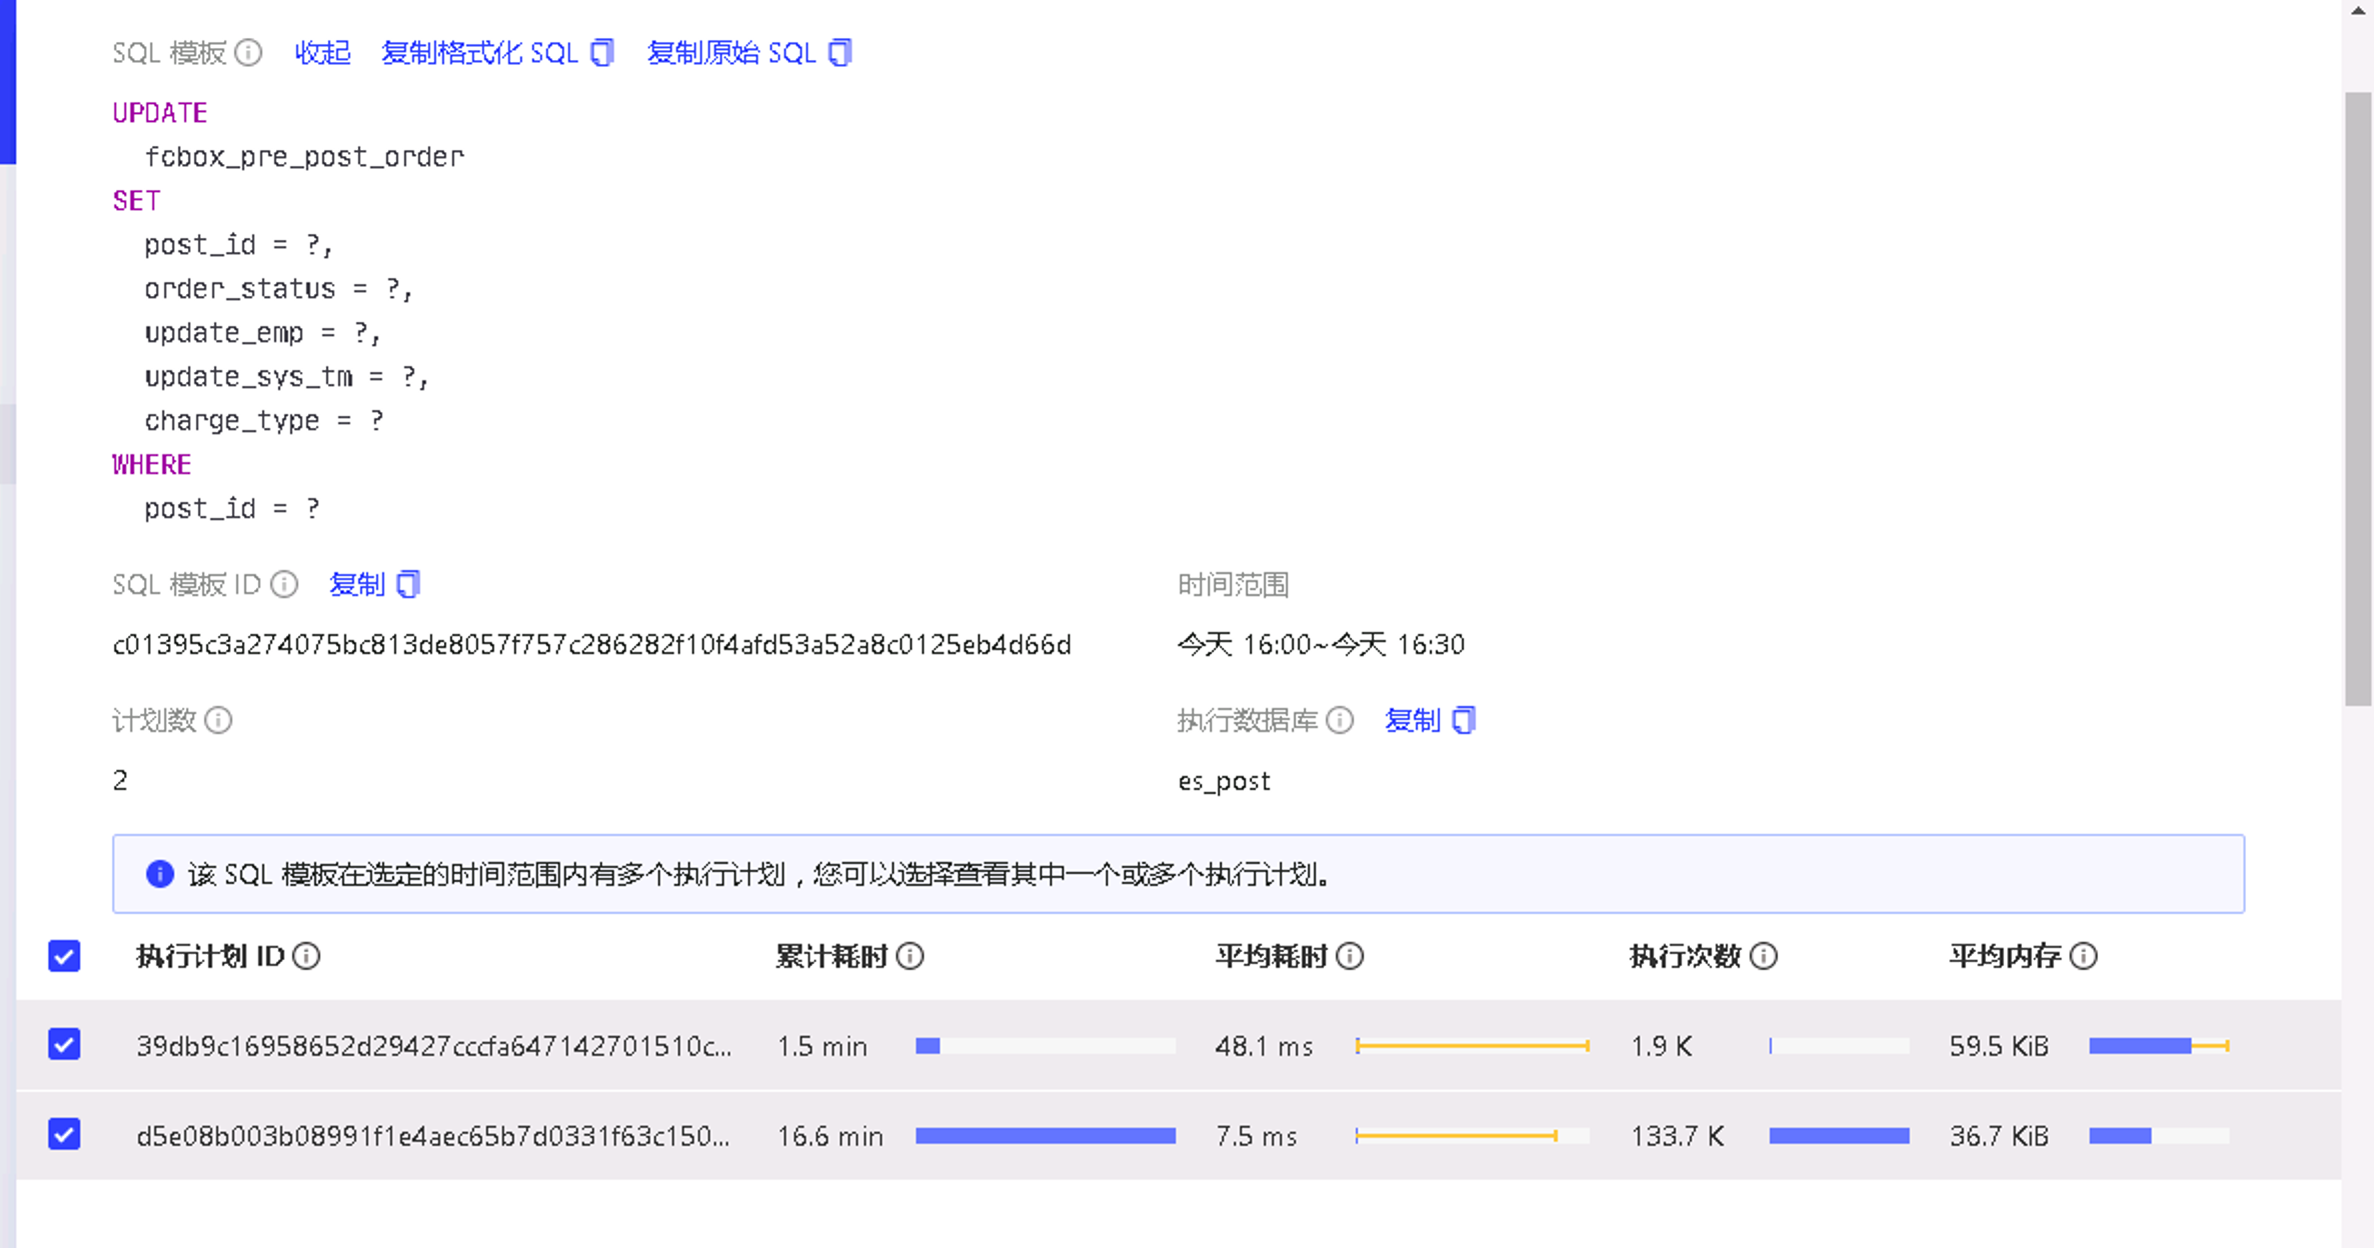
【概述】 少量update 语句出现3秒以上的延时,发现是prewrite:3.52过高,经查询由于update的执行计划不同导致,但是未查出具体哪里出的问题
【背景】
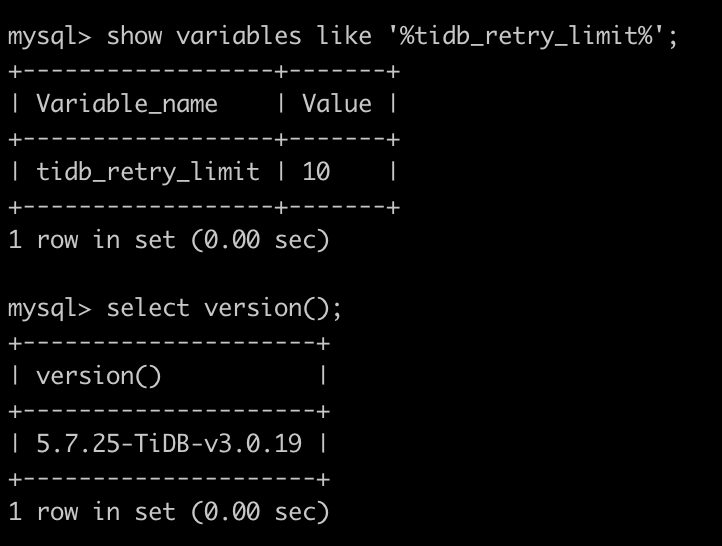
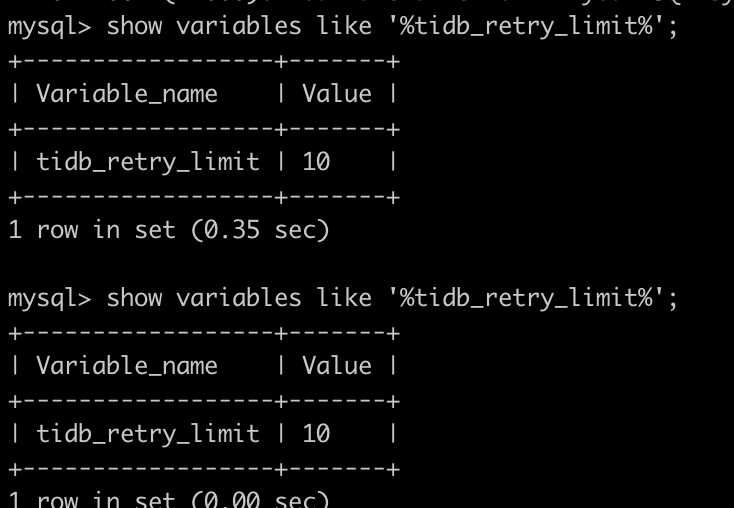
录制3.0TiDB中的语句实时写到4.0验证4.0集群发现的慢SQL
【现象】
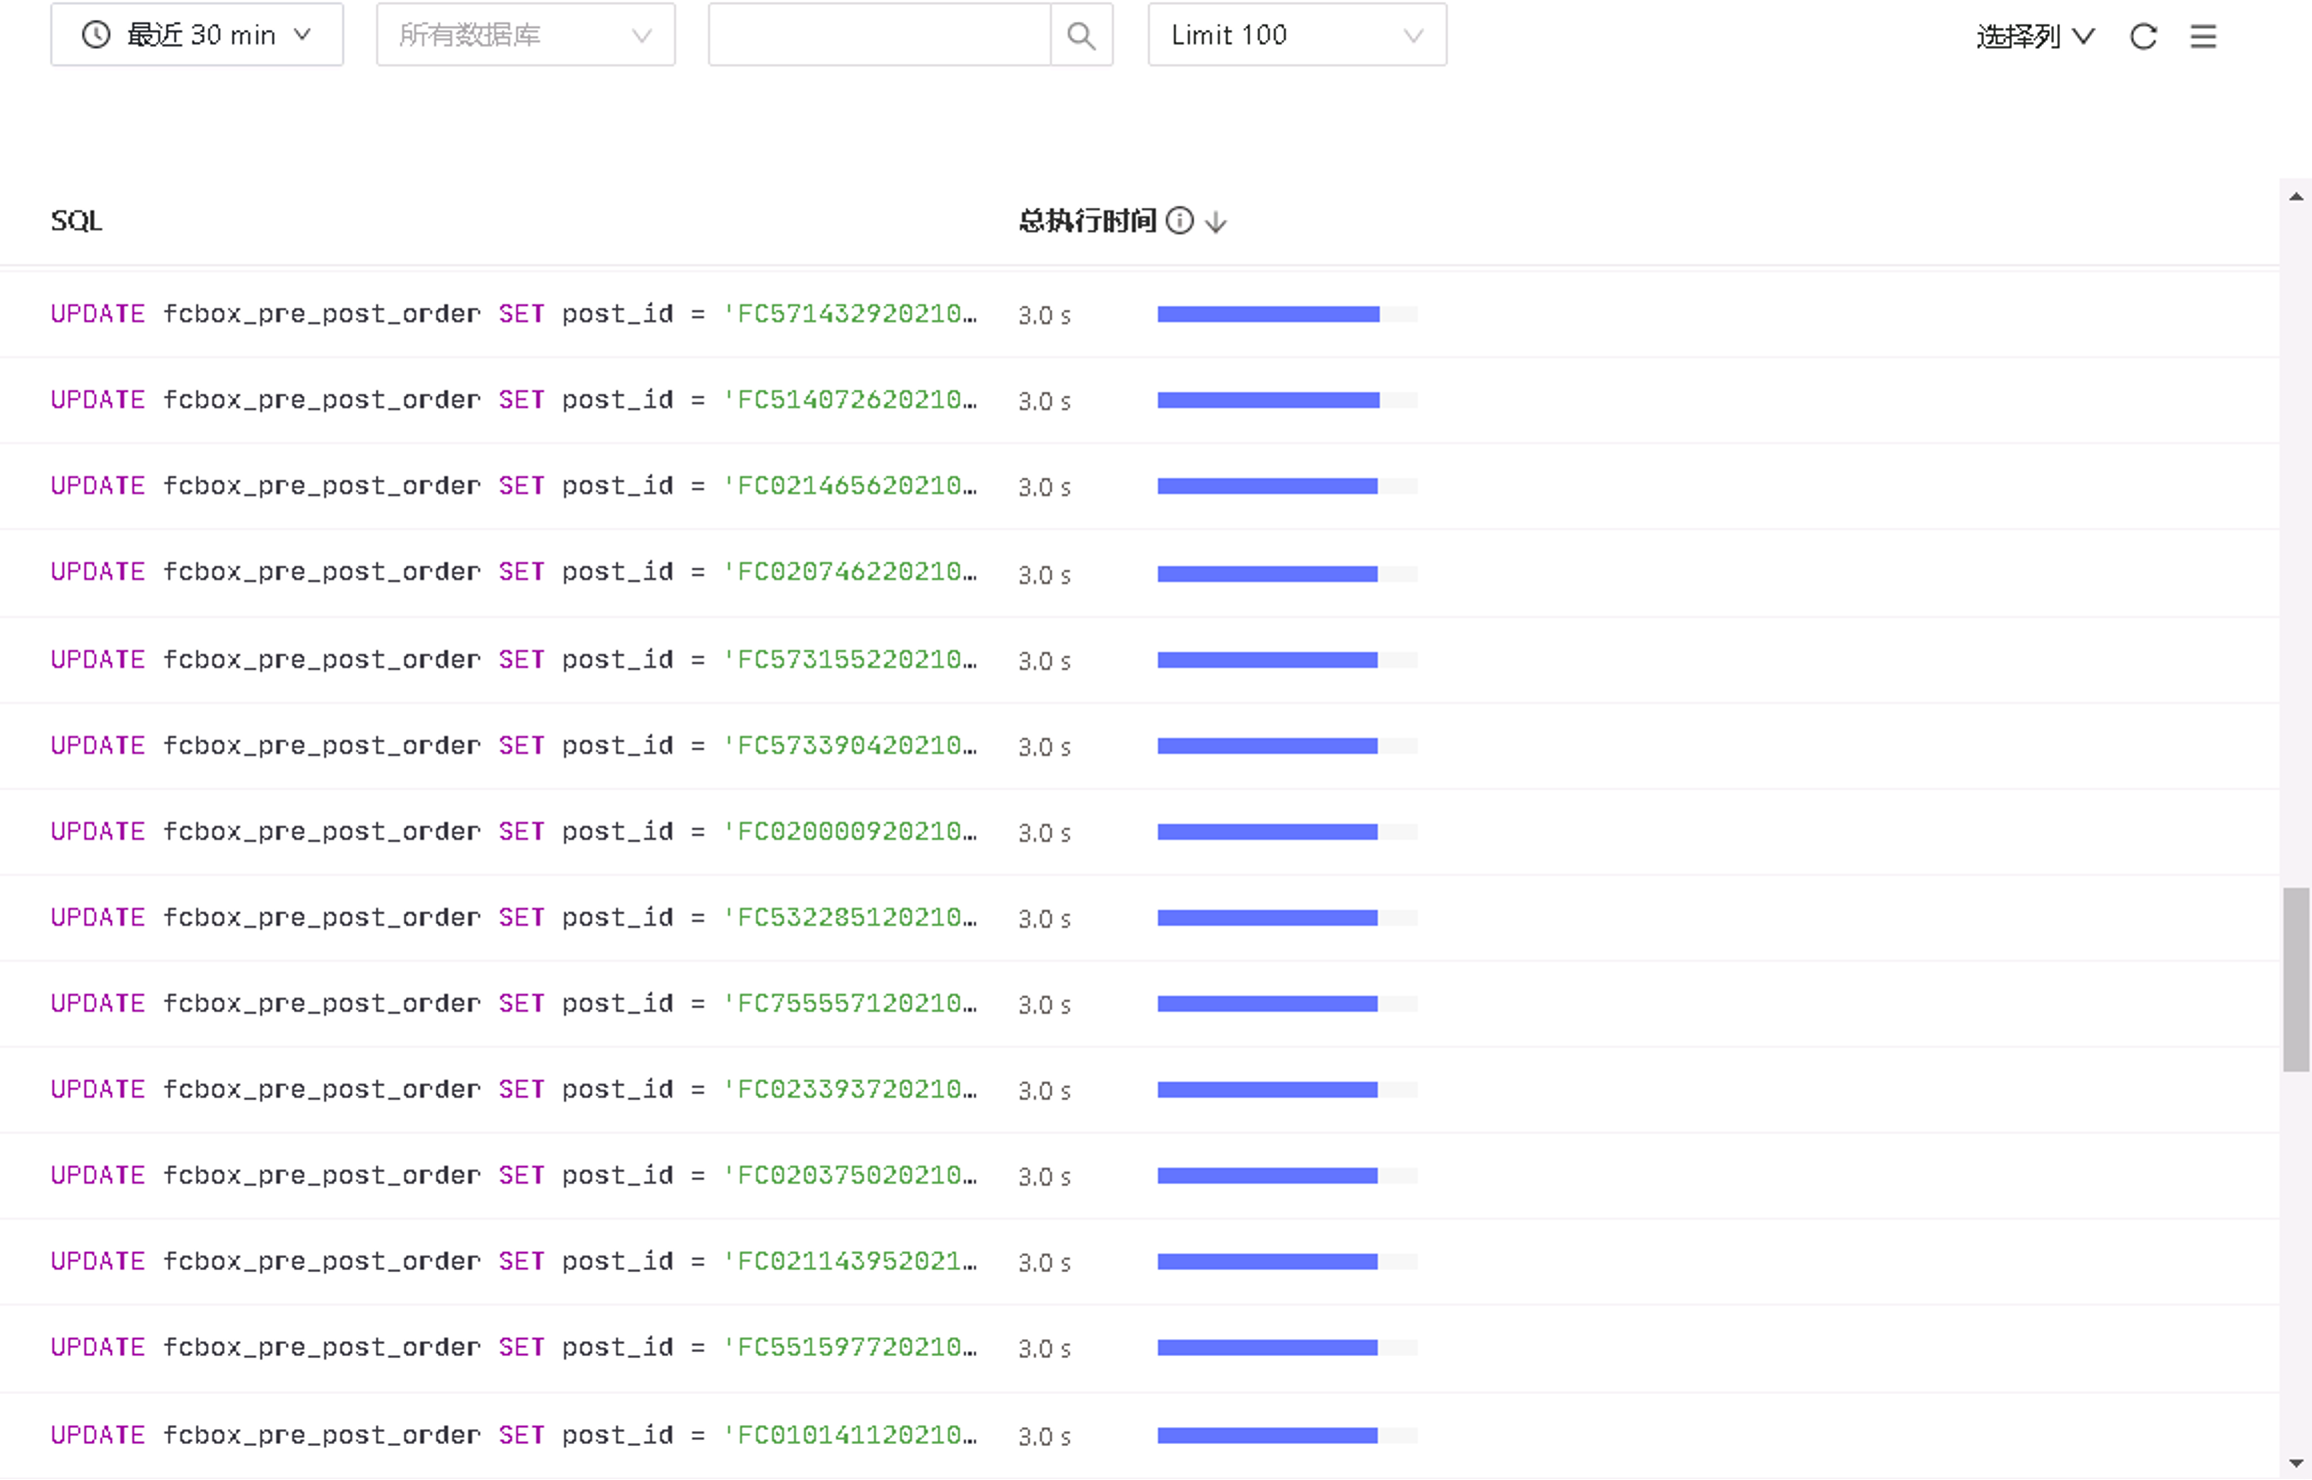
通过流量复制验证4.0,有大量3秒超时的慢查询,报的错是被其他事务锁住了导致回退。但是在3.0的集群中未遇到这种情况。
SQL
UPDATE
  fcbox_pre_post_order
SET
  post_id = '123456',
  order_status = 300,
  update_emp = 'sys',
  update_sys_tm = '2021-07-21 15:50:39.449',
  charge_type = 1
WHERE
  post_id = '123456';
慢查询的执行计划
id                     	task     	estRows	operator info                                                                                                                                      	actRows	execution info                                                                                                                                                                                                                                                                                                                                                                   	memory 	disk
	Update_5               	root     	0      	N/A                                                                                                                                                	0      	time:3.15ms, loops:1, , commit_txn: {prewrite:3.52s, backoff: {time: 3.51s, type: [txnNotFound]}, resolve_lock: 3.52s, region_num:4, write_keys:5, write_byte:429, txn_retry:1}, lock_keys: {time:8.38ms, region:1, keys:1, lock_rpc:8.359945ms, rpc_count:1}                                                                                                                    	14.4 KB	N/A
	└─SelectLock_7         	root     	1.12   	for update                                                                                                                                         	0      	                                                                                                                                                                                                                                                                                                                                                                                 	N/A    	N/A
	  └─IndexLookUp_13     	root     	1.12   	                                                                                                                                                   	1      	time:2.94ms, loops:2, index_task: {total_time: 724µs, fetch_handle: 721.9µs, build: 653ns, wait: 1.48µs}, table_task: {total_time: 5.16ms, num: 1, concurrency: 4}                                                                                                                                                                                                            	22.4 KB	N/A
	    ├─IndexRangeScan_11	cop[tikv]	1.12   	table:fcbox_pre_post_order, index:idx_post_id(post_id), range:["123456","123456"], keep order:false	1      	time:2.21ms, loops:5, index_task: {total_time: 461µs, fetch_handle: 457.8µs, build: 1.09µs, wait: 2.12µs}, table_task: {total_time: 2.98ms, num: 1, concurrency: 4}, cop_task: {num: 1, max: 674.3µs, proc_keys: 1, tot_proc: 1ms, rpc_num: 1, rpc_time: 655.6µs, copr_cache: disabled}, tikv_task:{time:1ms, loops:1}, scan_detail: {total_process_keys: 1, total_keys: 2}	22.4 KB	N/A
	    └─TableRowIDScan_12	cop[tikv]	1.12   	table:fcbox_pre_post_order, keep order:false                                                                                                       	1      	time:1.93ms, loops:2, cop_task: {num: 1, max: 1.84ms, proc_keys: 1, rpc_num: 1, rpc_time: 1.82ms, copr_cache: disabled}, tikv_task:{time:0s, loops:1}, scan_detail: {total_process_keys: 1, total_keys: 1}                                                                                                                                                                       	N/A    	N/A
该SQL有两个执行计划,一个正常一个不正常。
正常的执行计划
	id                   	task     	estRows	operator info                                                                                                                                      	actRows	execution info                                                                                                                                                                                                               	memory 	disk
	Update_4             	root     	0      	N/A                                                                                                                                                	0      	time:1.55ms, loops:1, , commit_txn: {prewrite:1.28ms, get_commit_ts:137.2µs, commit:1.01ms, region_num:3, write_keys:3, write_byte:395}                                                                                     	14.4 KB	N/A
	└─IndexLookUp_11     	root     	1.12   	                                                                                                                                                   	1      	time:1.39ms, loops:2, index_task: {total_time: 663.1µs, fetch_handle: 660.5µs, build: 710ns, wait: 1.87µs}, table_task: {total_time: 3.44ms, num: 1, concurrency: 4}                                                      	22.4 KB	N/A
	  ├─IndexRangeScan_9 	cop[tikv]	1.12   	table:fcbox_pre_post_order, index:idx_post_id(post_id), range:["123456","123456"], keep order:false	1      	time:657.8µs, loops:3, cop_task: {num: 1, max: 626µs, proc_keys: 1, tot_proc: 1ms, rpc_num: 1, rpc_time: 613.9µs, copr_cache: disabled}, tikv_task:{time:0s, loops:1}, scan_detail: {total_process_keys: 1, total_keys: 2}	N/A    	N/A
	  └─TableRowIDScan_10	cop[tikv]	1.12   	table:fcbox_pre_post_order, keep order:false
不正常的执行计划里面多了└─SelectLock_7 root 1.12 for update 。
在3.0都没遇到过这种语句。
【问题】 消除该执行计划不同
【TiDB 版本】
V4.0.13
【应用软件及版本】
【附件】 相关日志及配置信息
- TiUP Cluster Display 信息
- TiUP CLuster Edit config 信息
监控(https://metricstool.pingcap.com/)
- TiDB-Overview Grafana监控
- TiDB Grafana 监控
- TiKV Grafana 监控
- PD Grafana 监控
- 对应模块日志(包含问题前后 1 小时日志)