现在 tidb 集群有三台机器,其中机器 37 因为 gcc 包的问题,导致机器 37 很多命令无法使用,包括如 rm ,pdkg,vim,等等,并且 ssh 也连接不上。但是很奇怪 , tiup cluster display cluster_name 查看集群各个节点的状态时,都是显示正常的。全部节点都是 UP 。
后面的想法就是新扩容一台机器进来,等扩容完成后,再将部署在有问题机器上的节点给下线掉。
因此现在需要扩容两个节点,分别是 pd 和 tikv 。扩容到机器 27 上,扩容完成后,报了一个错,错误内容如下:
Error: init config failed: 10.20.70.37:12379: transfer from /home/tidb/.tiup/storage/cluster/clusters/rimedata/config-cache/pd-10.20.70.37-12379.service to /tmp/pd_c72ae045-ebb9-46c4-bdff-53857cbad262.service failed: failed to scp /home/tidb/.tiup/storage/cluster/clusters/rimedata/config-cache/pd-10.20.70.37-12379.service to tidb@10.20.70.37:/tmp/pd_c72ae045-ebb9-46c4-bdff-53857cbad262.service: ssh: handshake failed: read tcp 10.20.70.39:35672->10.20.70.37:22: read: connection reset by peer

Verbose debug logs has been written to /home/tidb/.tiup/logs/tiup-cluster-debug-2022-06-22-02-09-55.log.
Error: run `/home/tidb/.tiup/components/cluster/v1.7.0/tiup-cluster` (wd:/home/tidb/.tiup/data/T9RrUFS) failed: exit status 1
这个错误的原因就在于无法 ssh 到机器 37。
但是目前来看这个错误并不影响到扩容,通过 tiup cluster display cluster_name 再次查看集群状态的时候,tikv ,pd 都扩容成功了
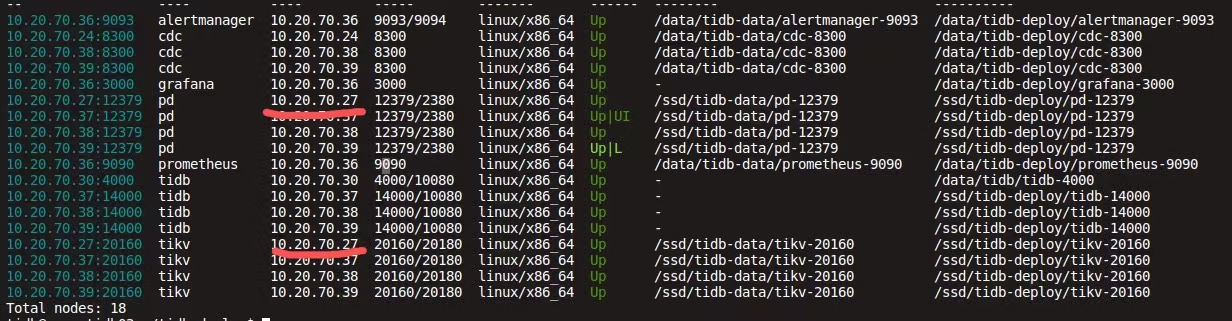
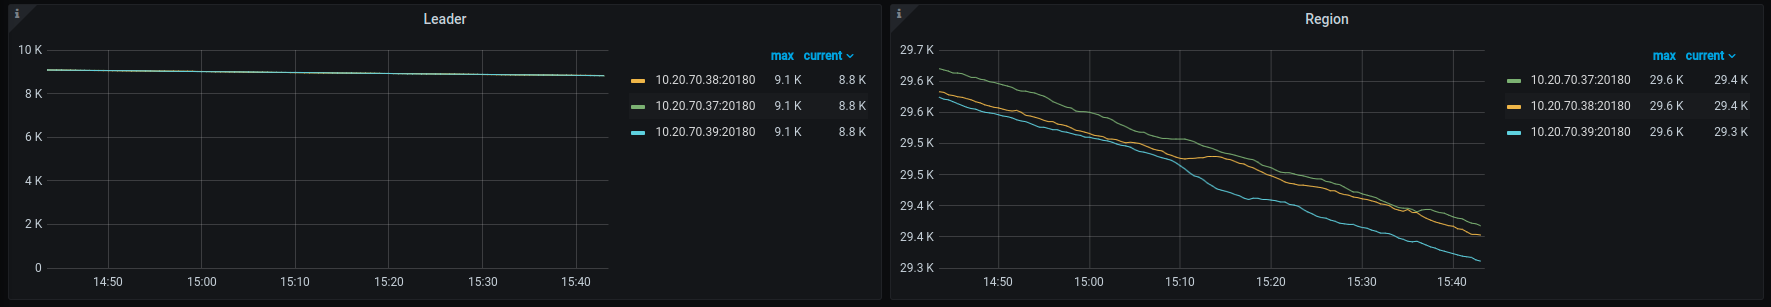
并且通过 ctl 命令也可以看到 27 机器上的 tikv 节点正在进行 region 平衡
Starting component `ctl`: /home/tidb/.tiup/components/ctl/v5.3.0/ctl pd -u http://10.20.70.39:12379 store
{
  "count": 4,
  "stores": [
    {
      "store": {
        "id": 240720,
        "address": "10.20.70.27:20160",
        "labels": [
          {
            "key": "host",
            "value": "tikv4"
          }
        ],
        "version": "5.3.0",
        "status_address": "10.20.70.27:20180",
        "git_hash": "6c1424706f3d5885faa668233f34c9f178302f36",
        "start_timestamp": 1655891928,
        "deploy_path": "/ssd/tidb-deploy/tikv-20160/bin",
        "last_heartbeat": 1655878605388129027,
        "state_name": "Up"
      },
      "status": {
        "capacity": "3.438TiB",
        "available": "3.16TiB",
        "used_size": "66.96GiB",
        "leader_count": 3214,
        "leader_weight": 1,
        "leader_score": 3214,
        "leader_size": 261006,
        "region_count": 3255,
        "region_weight": 1,
        "region_score": 287107.11842109315,
        "region_size": 264534,
        "slow_score": 1,
        "start_ts": "2022-06-22T09:58:48Z",
        "last_heartbeat_ts": "2022-06-22T06:16:45.388129027Z"
      }
    },
    {
      "store": {
        "id": 1,
        "address": "10.20.70.39:20160",
        "labels": [
          {
            "key": "host",
            "value": "tikv3"
          }
        ],
        "version": "5.3.0",
        "status_address": "10.20.70.39:20180",
        "git_hash": "6c1424706f3d5885faa668233f34c9f178302f36",
        "start_timestamp": 1654872483,
        "deploy_path": "/ssd/tidb-deploy/tikv-20160/bin",
        "last_heartbeat": 1655878598630384863,
        "state_name": "Up"
      },
      "status": {
        "capacity": "1.718TiB",
        "available": "960.3GiB",
        "used_size": "649.6GiB",
        "leader_count": 9194,
        "leader_weight": 1,
        "leader_score": 9194,
        "leader_size": 753548,
        "region_count": 29676,
        "region_weight": 1,
        "region_score": 2986624.451327592,
        "region_size": 2416447,
        "slow_score": 1,
        "start_ts": "2022-06-10T14:48:03Z",
        "last_heartbeat_ts": "2022-06-22T06:16:38.630384863Z",
        "uptime": "279h28m35.630384863s"
      }
    },
    {
      "store": {
        "id": 4,
        "address": "10.20.70.38:20160",
        "labels": [
          {
            "key": "host",
            "value": "tikv2"
          }
        ],
        "version": "5.3.0",
        "status_address": "10.20.70.38:20180",
        "git_hash": "6c1424706f3d5885faa668233f34c9f178302f36",
        "start_timestamp": 1654875638,
        "deploy_path": "/ssd/tidb-deploy/tikv-20160/bin",
        "last_heartbeat": 1655878597208326791,
        "state_name": "Up"
      },
      "status": {
        "capacity": "1.718TiB",
        "available": "976GiB",
        "used_size": "647.7GiB",
        "leader_count": 9186,
        "leader_weight": 1,
        "leader_score": 9186,
        "leader_size": 744136,
        "region_count": 29694,
        "region_weight": 1,
        "region_score": 2986642.1116330107,
        "region_size": 2420897,
        "slow_score": 1,
        "sending_snap_count": 1,
        "start_ts": "2022-06-10T15:40:38Z",
        "last_heartbeat_ts": "2022-06-22T06:16:37.208326791Z",
        "uptime": "278h35m59.208326791s"
      }
    },
    {
      "store": {
        "id": 5,
        "address": "10.20.70.37:20160",
        "labels": [
          {
            "key": "host",
            "value": "tikv1"
          }
        ],
        "version": "5.3.0",
        "status_address": "10.20.70.37:20180",
        "git_hash": "6c1424706f3d5885faa668233f34c9f178302f36",
        "start_timestamp": 1654853824,
        "deploy_path": "/ssd/tidb-deploy/tikv-20160/bin",
        "last_heartbeat": 1655878601489828812,
        "state_name": "Up"
      },
      "status": {
        "capacity": "1.718TiB",
        "available": "979.4GiB",
        "used_size": "652.6GiB",
        "leader_count": 9192,
        "leader_weight": 1,
        "leader_score": 9192,
        "leader_size": 749305,
        "region_count": 29734,
        "region_weight": 1,
        "region_score": 2986728.814431181,
        "region_size": 2422184,
        "slow_score": 1,
        "start_ts": "2022-06-10T09:37:04Z",
        "last_heartbeat_ts": "2022-06-22T06:16:41.489828812Z",
        "uptime": "284h39m37.489828812s"
      }
    }
  ]
}
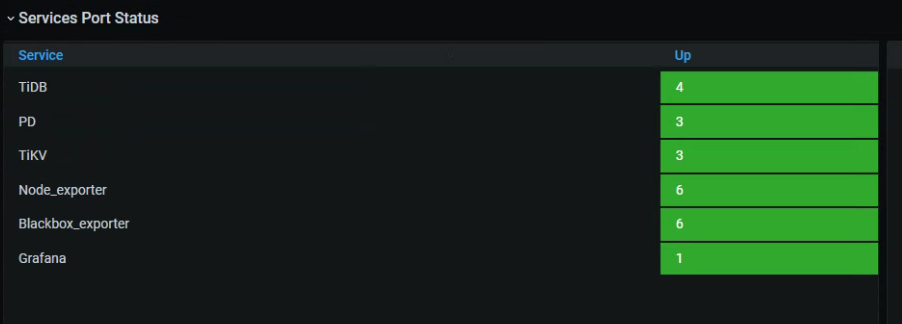
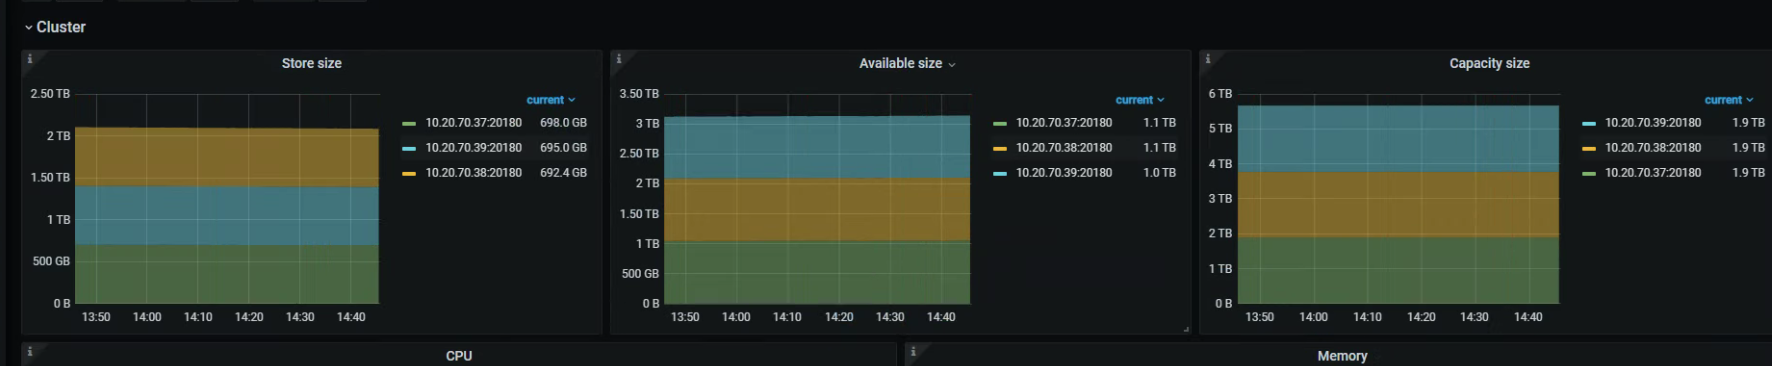
但是此时进入 grafana 的 rimedata-Overview 中查看每个实例的数量,却没发现新扩容的 pd 和 TIKV 实例,此时 pd 和 tikv 的数量应该为 4 的
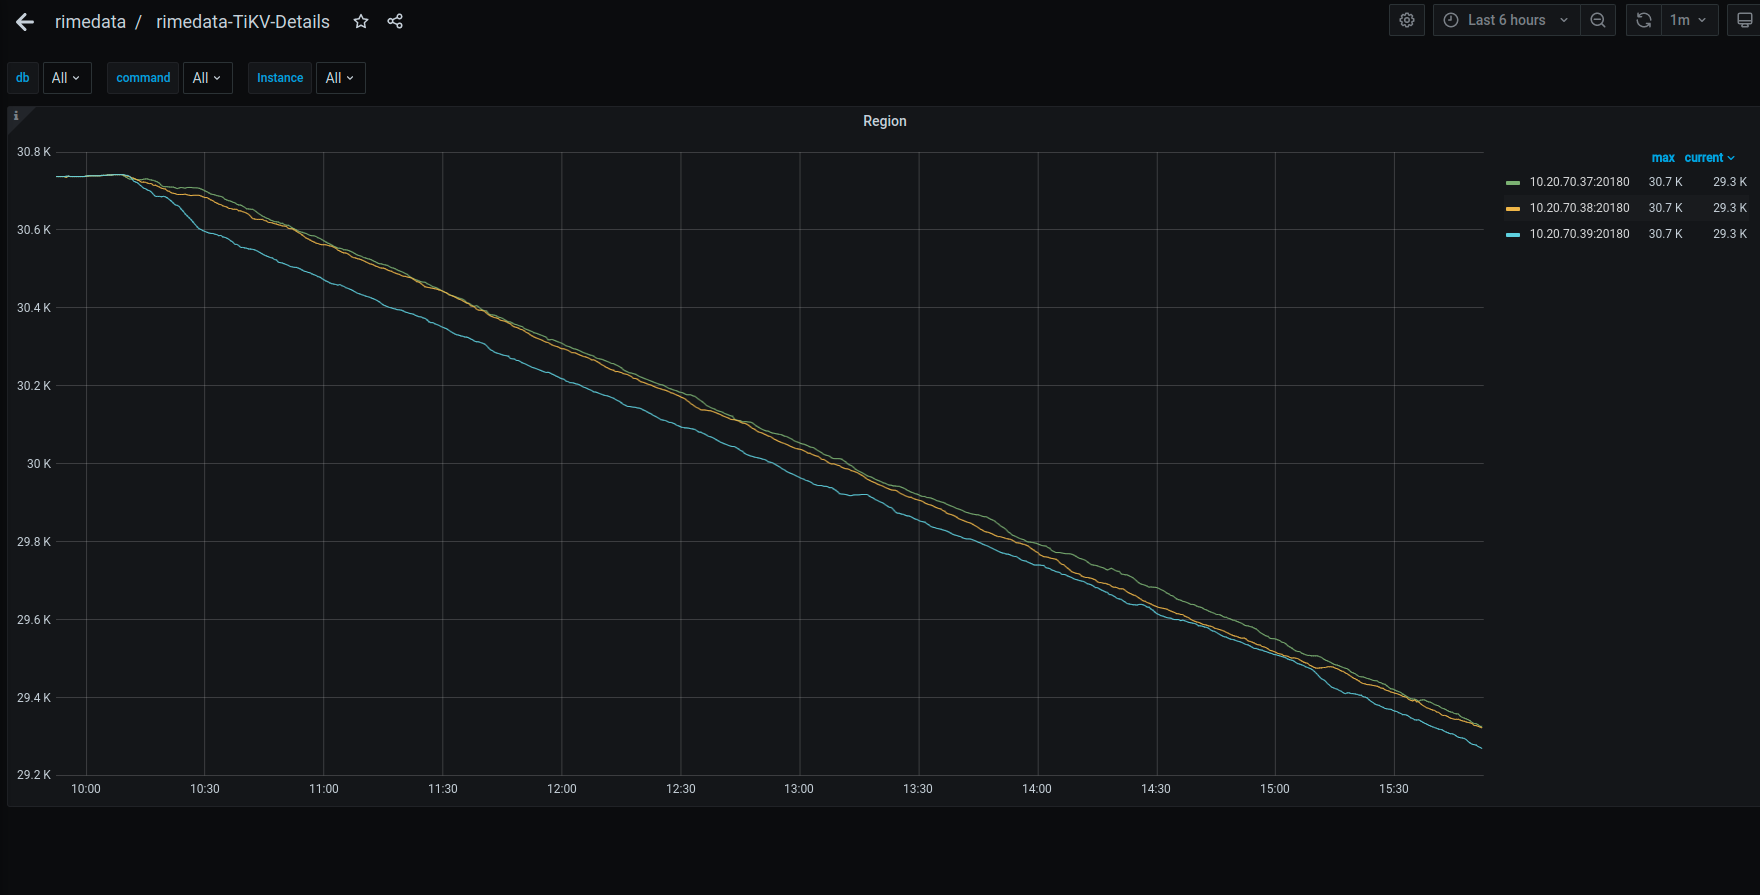
并且 tikv-details 页面上的数据也有问题,看不到新扩容的 tikv 节点的信息
想问一下,tikv 节点扩容成功后,但是 grafana 中的没有新扩容的 tikv 节点的信息正常吗?