seiang
(Seiang)
1
【 TiDB 使用环境】生产\测试环境\ POC
【 TiDB 版本】
v5.0.3
【遇到的问题】
通过TiCDC将TiDB集群中的一张表数据同步到MySQL,延迟不断的增大
sink-uri配置如下:
–sink-uri=mysql://dba_xxx:xxx@192.168.xx.xx:3306/?worker-count=128&max-txn-row=5000&safe-mode=true --changefeed-id=sync-task --sort-engine=unified --config=./xx_changefeed.toml
配置文件内容:
case-sensitive = true
enable-old-value = false


[filter]
ignore-txn-start-ts = [1, 2]
rules = ['db1.tabl1']


[mounter]
worker-num = 128


[sink]
# 对于 MQ 类的 Sink,可以通过 dispatchers 配置 event 分发器
# 支持 default、ts、rowid、table 四种分发器,分发规则如下:
# - default:有多个唯一索引(包括主键)时按照 table 模式分发;只有一个唯一索引(或主键)按照 rowid 模式分发;如果开启了 old value 特性,按照 table 分发
# - ts:以行变更的 commitTs 做 Hash 计算并进行 event 分发
# - rowid:以所选的 HandleKey 列名和列值做 Hash 计算并进行 event 分发
# - table:以表的 schema 名和 table 名做 Hash 计算并进行 event 分发
# matcher 的匹配语法和过滤器规则语法相同
#dispatchers = [
#    {matcher = ['test1.*', 'test2.*'], dispatcher = "ts"},
#    {matcher = ['test3.*', 'test4.*'], dispatcher = "rowid"},
#]
# 对于 MQ 类的 Sink,可以指定消息的协议格式
# 目前支持 default、canal、avro 和 maxwell 四种协议。default 为 TiCDC Open Protocol
#protocol = "maxwell"


[cyclic-replication]
enable = false
replica-id = 1
filter-replica-ids = [2,3]
sync-ddl = false
CDC日志:
cdc.log (3.9 MB)
【复现路径】做过哪些操作出现的问题
【问题现象及影响】
【附件】
- 相关日志、配置文件、Grafana 监控(https://metricstool.pingcap.com/)
- TiUP Cluster Display 信息
- TiUP CLuster Edit config 信息
- TiDB-Overview 监控
- 对应模块的 Grafana 监控(如有 BR、TiDB-binlog、TiCDC 等)
- 对应模块日志(包含问题前后 1 小时日志)
若提问为性能优化、故障排查类问题,请下载脚本运行。终端输出的打印结果,请务必全选并复制粘贴上传。
1 个赞
Meditator
(Wendywong020)
2
大概看了下日志
2022/05/06 11:33:32.397—2022/05/06 12:11:45.494
2022/05/06 12:12:41.975—2022/05/06 12:15:02.532
2022/05/06 12:16:03.148—2022/05/06 12:22:24.514
2022/05/06 12:22:58.936—2022/05/06 14:34:08.513
2022/05/06 14:56:08.863—2022/05/06 15:09:26.521
2022/05/06 15:16:00.839—2022/05/06 15:49:32.020
2022/05/06 16:18:26.715—2022/05/06 16:23:10.133
task有退出,伴随的错误如下:
[WARN] [task.go:151] ["parse task failed"] [capture-id=b8049ab0-11ed-41ba-953c-b19d5504709c] [error="[CDC:ErrChangeFeedNotExists]changefeed not exists, key: /tidb/cdc/changefeed/info/his-sync-task"] [errorVerbose="[CDC:ErrChangeFeedNotExists]changefeed not exists, key: /tidb/cdc/changefeed/info/his-sync-task\
github.com/pingcap/errors.AddStack\
\tgithub.com/pingcap/errors@v0.11.5-0.20201126102027-b0a155152ca3/errors.go:174\
github.com/pingcap/errors.(*Error).GenWithStackByArgs\
\tgithub.com/pingcap/errors@v0.11.5-0.20201126102027-b0a155152ca3/normalize.go:156\
github.com/pingcap/ticdc/cdc/kv.CDCEtcdClient.GetChangeFeedInfo\
\tgithub.com/pingcap/ticdc@/cdc/kv/etcd.go:207\
github.com/pingcap/ticdc/cdc.(*TaskWatcher).parseTask\
\tgithub.com/pingcap/ticdc@/cdc/task.go:172\
github.com/pingcap/ticdc/cdc.(*TaskWatcher).watch\
\tgithub.com/pingcap/ticdc@/cdc/task.go:149\
runtime.goexit\
\truntime/asm_amd64.s:1357"]
这个是内部触发的还是人工触发的?
1 个赞
seiang
(Seiang)
3
这个是人工触发的,我这边在不断的调整相关–sink-uri以及配置文件相关参数
1 个赞
Meditator
(Wendywong020)
4
region 1899576
看看region信息
1 个赞
seiang
(Seiang)
5
» region 1899576
{
  "id": 1899576,
  "start_key": "7480000000000002FF455F728000000007FF7B72FD0000000000FA",
  "end_key": "7480000000000002FF555F698000000000FF0000010400000000FF0000019104000000FF000ABF3B17040000FF00001CDC16B10400FF000000000001B804FF0000000000175D48FF0400000000626ABCFFC300000000000000F8",
  "epoch": {
    "conf_ver": 317,
    "version": 8462
  },
  "peers": [
    {
      "id": 1899578,
      "store_id": 12,
      "role_name": "Voter"
    },
    {
      "id": 1899579,
      "store_id": 1,
      "role_name": "Voter"
    },
    {
      "id": 1981754,
      "store_id": 584564,
      "role_name": "Voter"
    }
  ],
  "leader": {
    "id": 1899579,
    "store_id": 1,
    "role_name": "Voter"
  },
  "written_bytes": 27472427,
  "read_bytes": 0,
  "written_keys": 93004,
  "read_keys": 0,
  "approximate_size": 71,
  "approximate_keys": 459534
}
1 个赞
Meditator
(Wendywong020)
6
[2022/05/06 16:27:34.161 +08:00] [WARN] [client.go:1126] [ScanRegions] [span="[7480000000000002ff455f728000000006ff3a82b70000000000fa, 7480000000000002ff4560000000000000f9)"] [regions="[{\"id\":1899576,\"start_key\":\"dIAAAAAAAAL/RV9ygAAAAAb/Ph7FAAAAAAD6\",\"end_key\":\"dIAAAAAAAAL/VV9pgAAAAAD/AAABBAAAAAD/AAABkQQAAAD/AAq/OxcEAAD/AAAc3BaxBAD/AAAAAAABuAT/AAAAAAAXXUj/BAAAAABiarz/wwAAAAAAAAD4\",\"region_epoch\":{\"conf_ver\":317,\"version\":8374},\"peers\":[{\"id\":1899578,\"store_id\":12},{\"id\":1899579,\"store_id\":1},{\"id\":1981754,\"store_id\":584564}]}]"] **[error="[CDC:ErrRegionsNotCoverSpan]regions not completely left cover span, span [7480000000000002ff455f728000000006ff3a82b70000000000fa, 7480000000000002ff4560000000000000f9) regions: [id:1899576 start_key:\"t\\200\\000\\000\\000\\000\\000\\002\\377E_r\\200\\000\\000\\000\\006\\377>\\036\\305\\000\\000\\000\\000\\000\\372\" end_key:\"t\\200\\000\\000\\000\\000\\000\\002\\377U_i\\200\\000\\000\\000\\000\\377\\000\\000\\001\\004\\000\\000\\000\\000\\377\\000\\000\\001\\221\\004\\000\\000\\000\\377\\000\\
\\277;\\027\\004\\000\\000\\377\\000\\000\\034\\334\\026\\261\\004\\000\\377\\000\\000\\000\\000\\000\\001\\270\\004\\377\\000\\000\\000\\000\\000\\027]H\\377\\004\\000\\000\\000\\000bj\\274\\377\\303\\000\\000\\000\\000\\000\\000\\000\\370\" region_epoch:<conf_ver:317 version:8374 > peers:<id:1899578 store_id:12 > peers:<id:1899579 store_id:1 > peers:<id:1981754 store_id:584564 > ]"] [errorVerbose="[CDC:ErrRegionsNotCoverSpan]regions not completely left cover span, span [7480000000000002ff455f728000000006ff3a82b70000000000fa, 7480000000000002ff4560000000000000f9) regions: [id:1899576 start_key:\"t\\200\\000\\000\\000\\000\\000\\002\\377E_r\\200\\000\\000\\000\\006\\377>\\036\\305\\000\\000\\000\\000\\000\\372\" end_key:\"t\\200\\000\\000\\000\\000\\000\\002\\377U_i\\200\\000\\000\\000\\000\\377\\000\\000\\001\\004\\000\\000\\000\\000\\377\\000\\000\\001\\221\\004\\000\\000\\000\\377\\000\\
\\277;\\027\\004\\000\\000\\377\\000\\000\\034\\334\\026\\261\\004\\000\\377\\000\\000\\000\\000\\000\\001\\270\\004\\377\\000\\000\\000\\000\\000\\027]H\\377\\004\\000\\000\\000\\000bj\\274\\377\\303\\000\\000\\000\\000\\000\\000\\000\\370\"** region_epoch:<conf_ver:317 version:8374 > peers:<id:1899578 store_id:12 > peers:<id:1899579 store_id:1 > peers:<id:1981754 store_id:584564 > ]\
github.com/pingcap/errors.AddStack\
\tgithub.com/pingcap/errors@v0.11.5-0.20201126102027-b0a155152ca3/errors.go:174\
github.com/pingcap/errors.(*Error).GenWithStackByArgs\
\tgithub.com/pingcap/errors@v0.11.5-0.20201126102027-b0a155152ca3/normalize.go:156\
github.com/pingcap/ticdc/cdc/kv.(*eventFeedSession).divideAndSendEventFeedToRegions.func1\
\tgithub.com/pingcap/ticdc@/cdc/kv/client.go:1125\
github.com/pingcap/ticdc/pkg/retry.Run.func1\
\tgithub.com/pingcap/ticdc@/pkg/retry/retry.go:32\
github.com/cenkalti/backoff.RetryNotify\
\tgithub.com/cenkalti/backoff@v2.2.1+incompatible/retry.go:37\
github.com/cenkalti/backoff.Retry\
\tgithub.com/cenkalti/backoff@v2.2.1+incompatible/retry.go:24\
github.com/pingcap/ticdc/pkg/retry.Run\
\tgithub.com/pingcap/ticdc@/pkg/retry/retry.go:31\
github.com/pingcap/ticdc/cdc/kv.(*eventFeedSession).divideAndSendEventFeedToRegions\
\tgithub.com/pingcap/ticdc@/cdc/kv/client.go:1101\
github.com/pingcap/ticdc/cdc/kv.(*eventFeedSession).eventFeed.func3.1\
\tgithub.com/pingcap/ticdc@/cdc/kv/client.go:627\
golang.org/x/sync/errgroup.(*Group).Go.func1\
\tgolang.org/x/sync@v0.0.0-20201020160332-67f06af15bc9/errgroup/errgroup.go:57\
runtime.goexit\
\truntime/asm_amd64.s:1357"]
[error="[CDC:ErrRegionsNotCoverSpan]regions not completely left cover span, span [7480000000000002ff455f728000000006ff3a82b70000000000fa, 7480000000000002ff4560000000000000f9) regions: [id:1899576 start_key:“t\200\000\000\000\000\000\002\377E_r\200\000\000\000\006\377>\036\305\000\000\000\000\000\372” end_key:“t\200\000\000\000\000\000\002\377U_i\200\000\000\000\000\377\000\000\001\004\000\000\000\000\377\000\000\001\221\004\000\000\000\377\000\
\277;\027\004\000\000\377\000\000\034\334\026\261\004\000\377\000\000\000\000\000\001\270\004\377\000\000\000\000\000\027]H\377\004\000\000\000\000bj\274\377\303\000\000\000\000\000\000\000\370” region_epoch:<conf_ver:317 version:8374 > peers:<id:1899578 store_id:12 > peers:<id:1899579 store_id:1 > peers:<id:1981754 store_id:584564 > ]"] [errorVerbose="[CDC:ErrRegionsNotCoverSpan]regions not completely left cover span, span [7480000000000002ff455f728000000006ff3a82b70000000000fa, 7480000000000002ff4560000000000000f9) regions: [id:1899576 start_key:“t\200\000\000\000\000\000\002\377E_r\200\000\000\000\006\377>\036\305\000\000\000\000\000\372” end_key:“t\200\000\000\000\000\000\002\377U_i\200\000\000\000\000\377\000\000\001\004\000\000\000\000\377\000\000\001\221\004\000\000\000\377\000\
\277;\027\004\000\000\377\000\000\034\334\026\261\004\000\377\000\000\000\000\000\001\270\004\377\000\000\000\000\000\027]H\377\004\000\000\000\000bj\274\377\303\000\000\000\000\000\000\000\370”
region_epoch:<conf_ver:317 version:8374 > peers:<id:1899578 store_id:12 > peers:<id:1899579 store_id:1 > peers:<id:1981754 store_id:584564 >
除了这个告警,也看不出什么异常。
1 个赞
YuJuncen
(Yu Juncen)
7
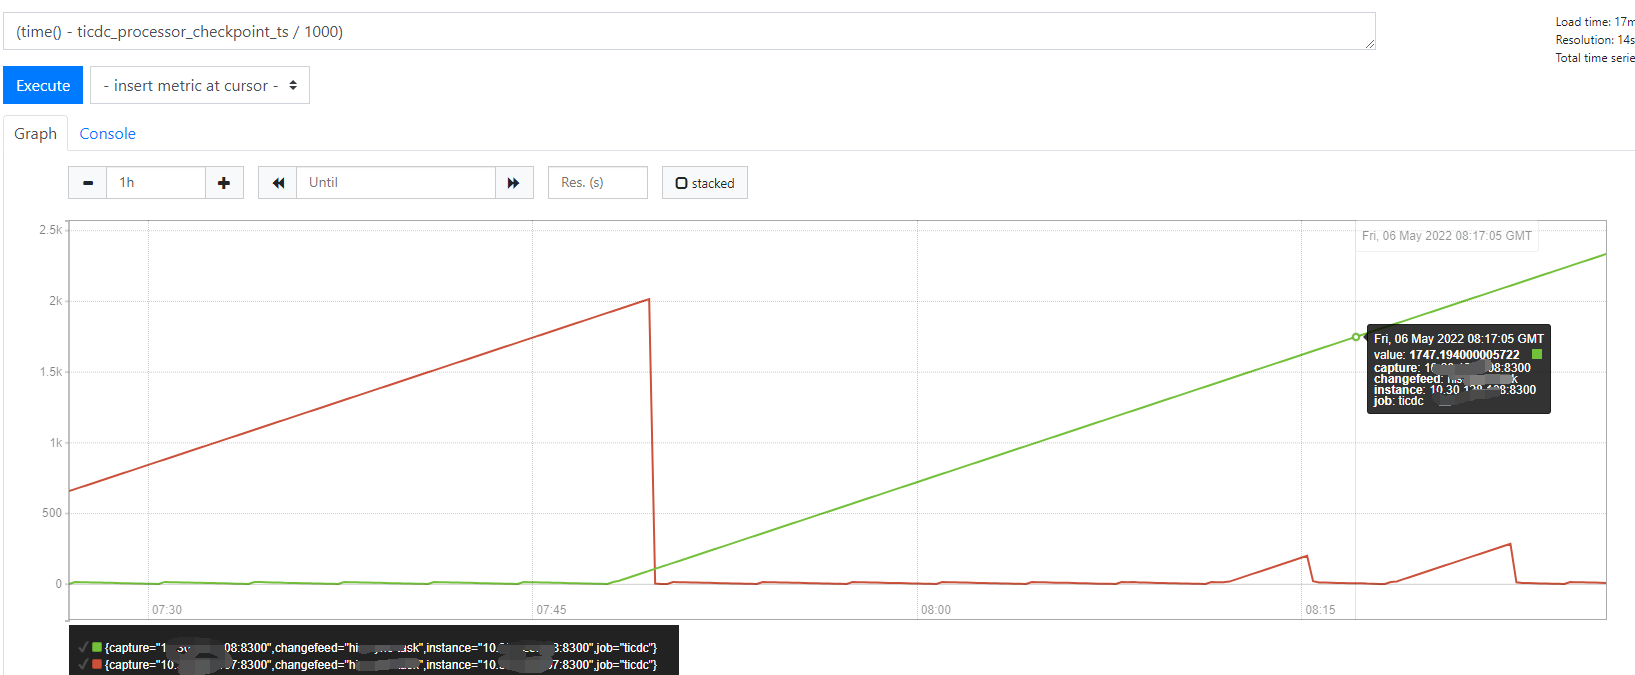
看起来 ticdc_processor_checkpoint_ts 这个监控项可能有些问题:它在 Task 被转移到其它节点的时候可能会留在旧的节点上,导致 time() - ticdc_processor_checkpoint_ts / 1000 的结果不正确。可以使用 ticdc_processor_checkpoint_ts_lag 来查询真正的 lag。
Ref:https://github.com/pingcap/tiflow/issues/4859
1 个赞
neilshen
(Neil Shen)
8
此外,麻烦提供如下信息
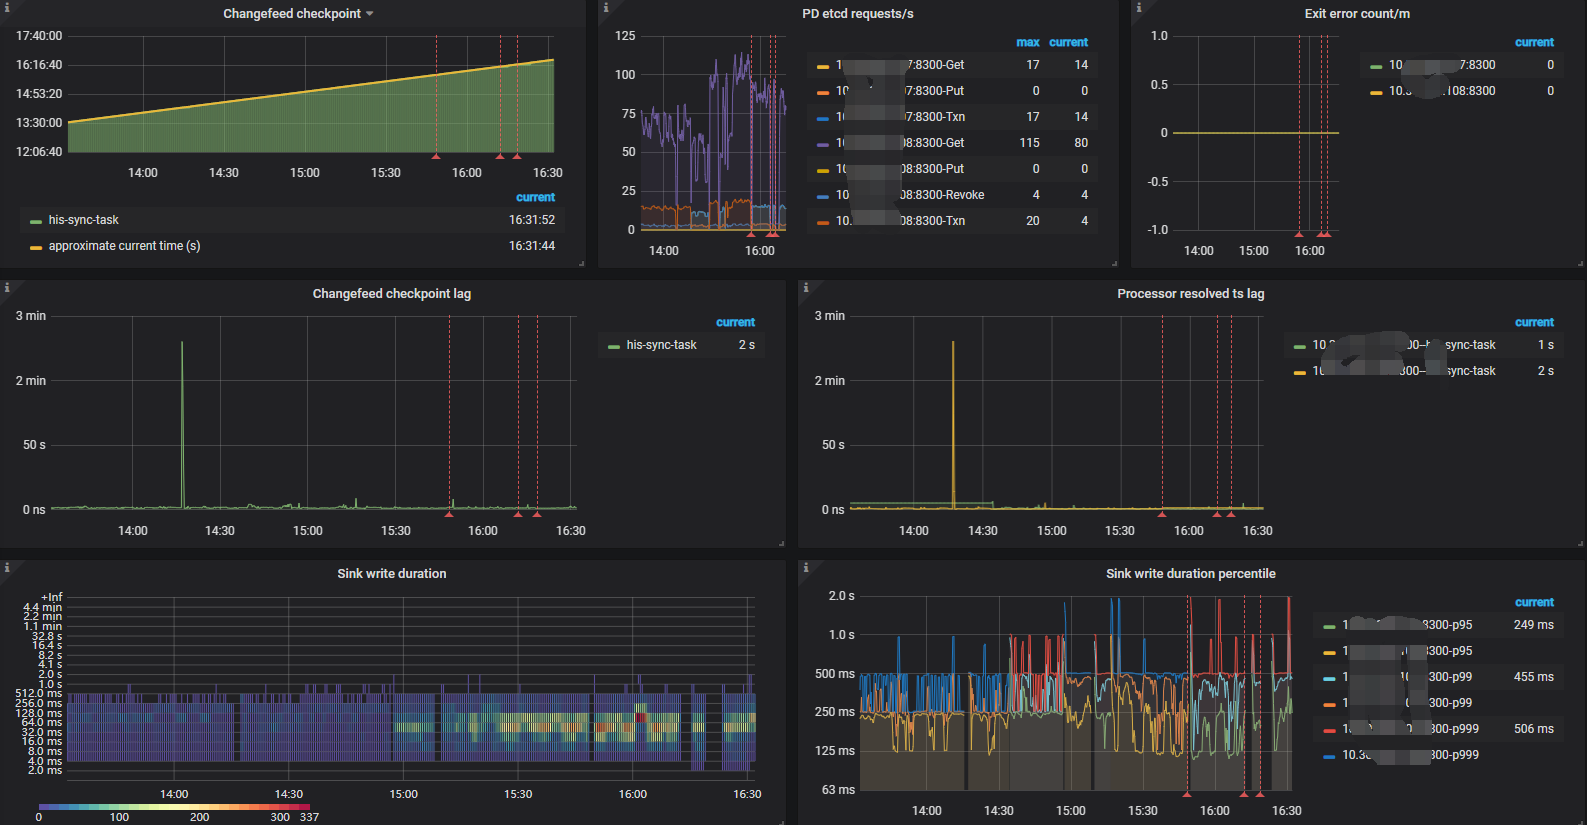
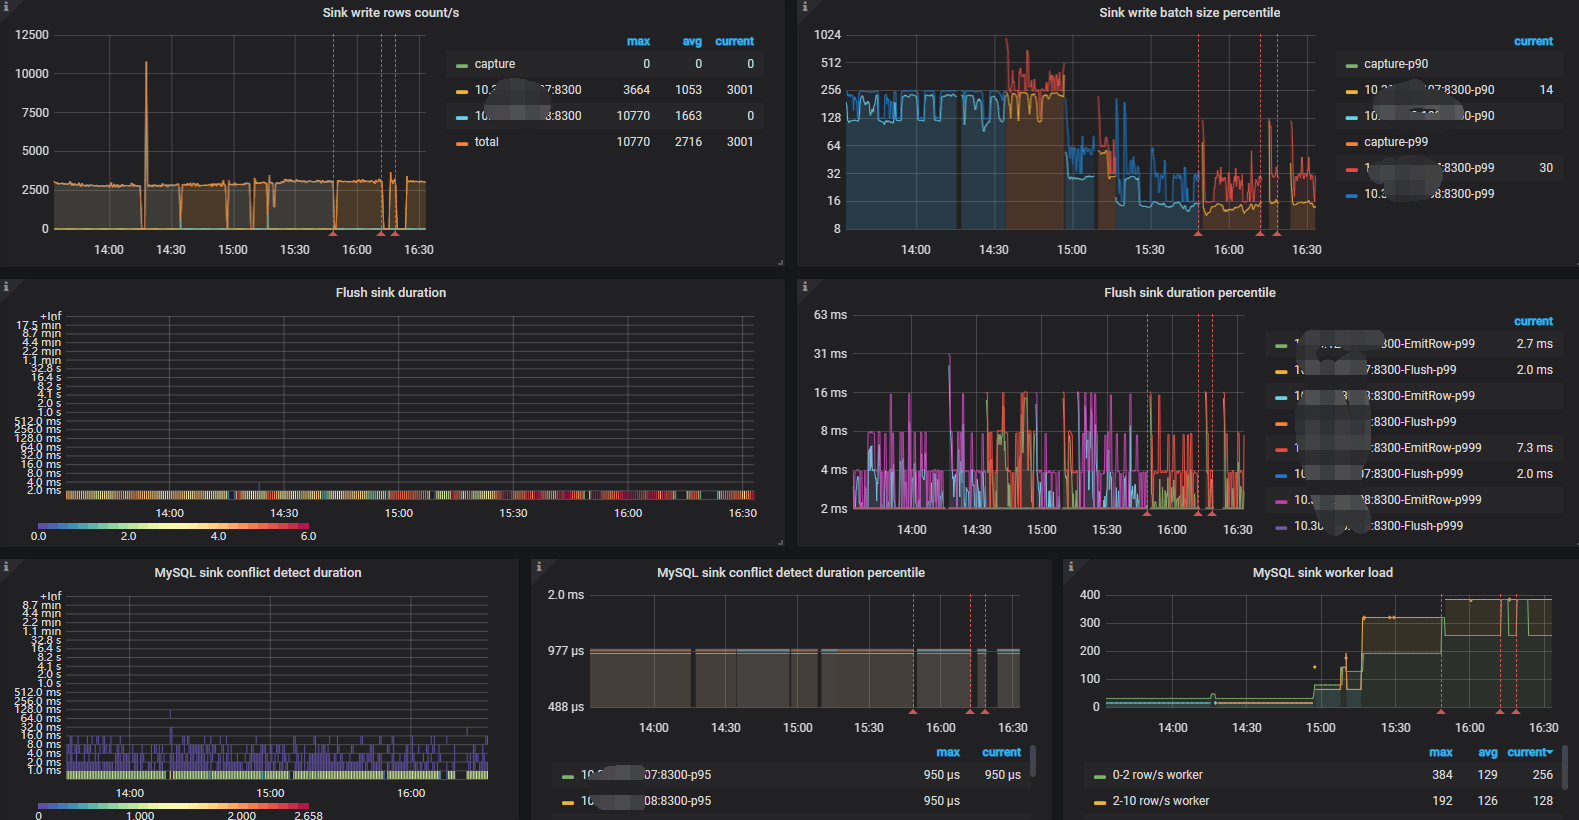
- 延时开始上升时的 TiCDC 监控,前后 10 分钟。
-
cdc cli --pd=<PDADDR> changefeed list 的执行结果。
- 延时上升时所有 cdc 节点的日志。
现有日志中的出现的报错 CDC:ErrRegionsNotCoverSpan 怀疑触发了一个已知问题,需要上述三个信息来确认。
已知问题: ScanRegions total retry time is too short · Issue #5230 · pingcap/tiflow (github.com)
seiang
(Seiang)
9
好像确实存在这个问题,除了 “它在 Task 被转移到其它节点的时候可能会留在旧的节点上,导致 time() - ticdc_processor_checkpoint_ts / 1000 的结果不正确”,还有就是如果把该task删除掉之后,使用cdc cli --pd= changefeed list看不到运行的任务, time() - ticdc_processor_checkpoint_ts / 1000 的结果也是一直在不断的增长,
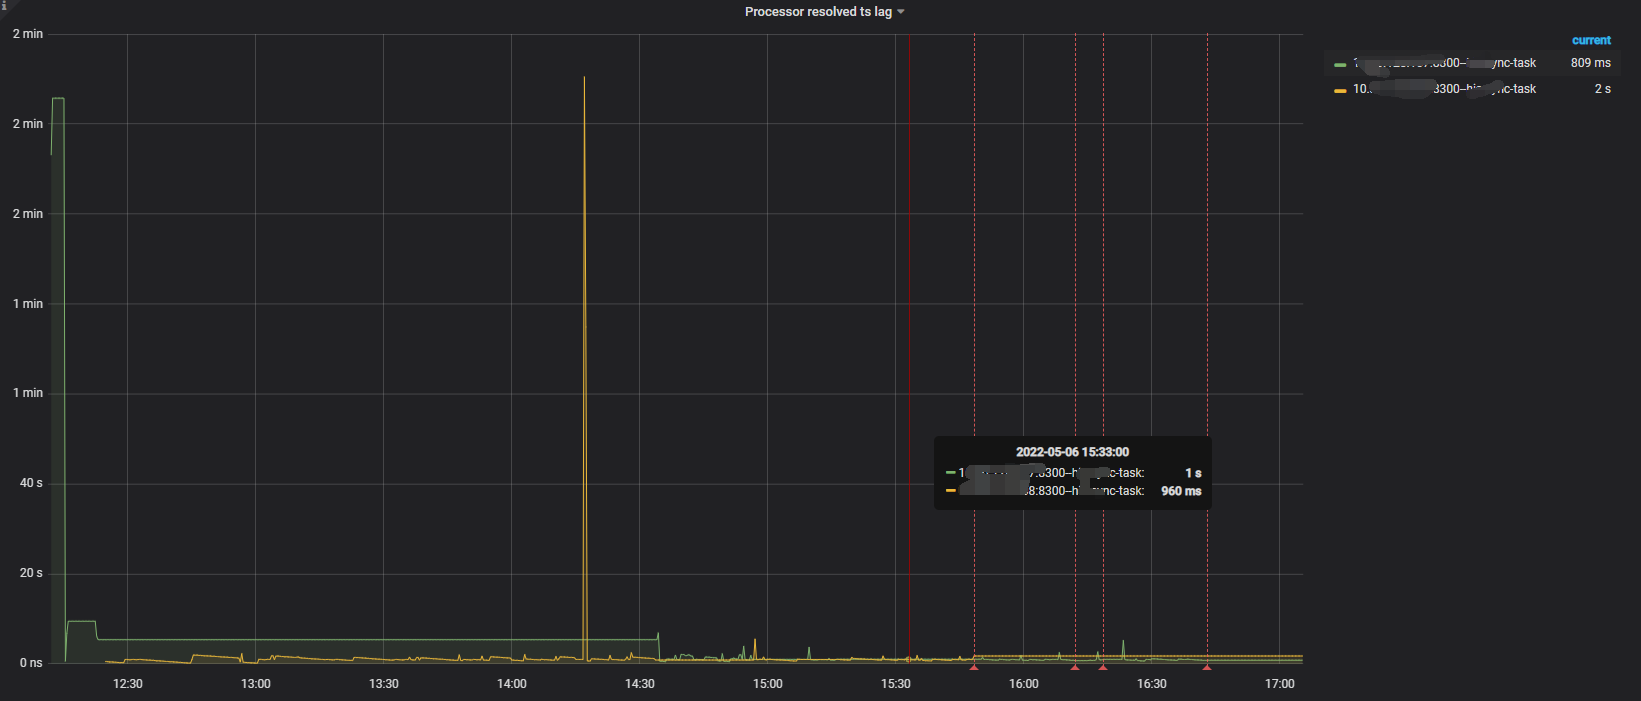
使用ticdc_processor_checkpoint_ts_lag来看是正常的
这种情况下有没有办法删除掉监控信息呢?还有就是task删除之后,在TiCDC监控看板上还是可以看到,监控看板是定时做删除吗?还是可以通过其他方法手动进行删除呢?
neilshen
(Neil Shen)
11
看起来和 #5230 无关,是残留的监控导致的。
这种情况下有没有办法删除掉监控信息呢?还有就是task删除之后,在TiCDC监控看板上还是可以看到,监控看板是定时做删除吗?还是可以通过其他方法手动进行删除呢?
手动删除如下
curl -X POST -g 'http://localhost:9090/api/v1/admin/tsdb/delete_series?match[]=a_bad_metric
参见 Deleting a Time Series - Prometheus Tutorials (sbcode.net)
1 个赞
system
(system)
关闭
12
此话题已在最后回复的 1 分钟后被自动关闭。不再允许新回复。