TiDB单节点内存持续升高oom

【 TiDB 使用环境】生产环境
【 TiDB 版本】v5.2.1
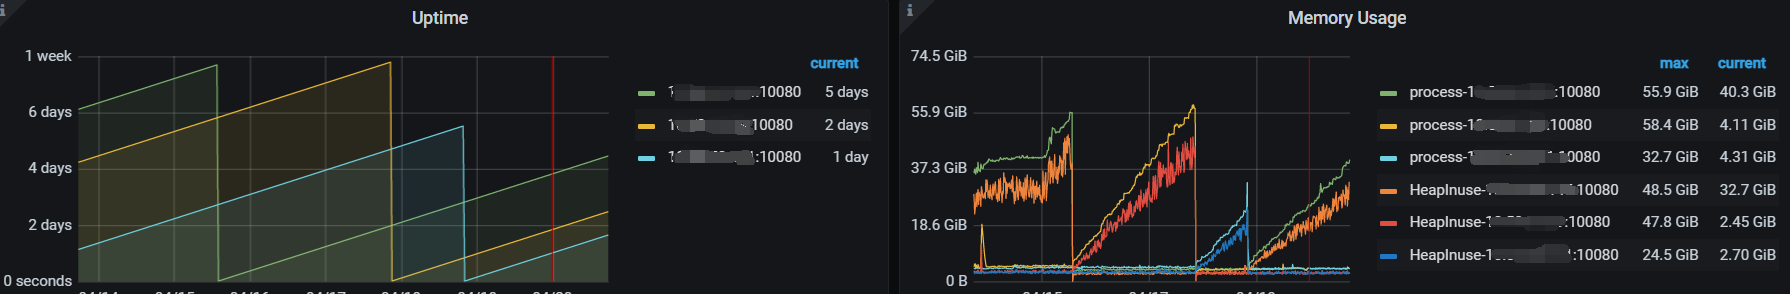
【遇到的问题】TiDB单节点内存持续升高,最终oom,已定位到问题
【复现路径】
【问题现象及影响】
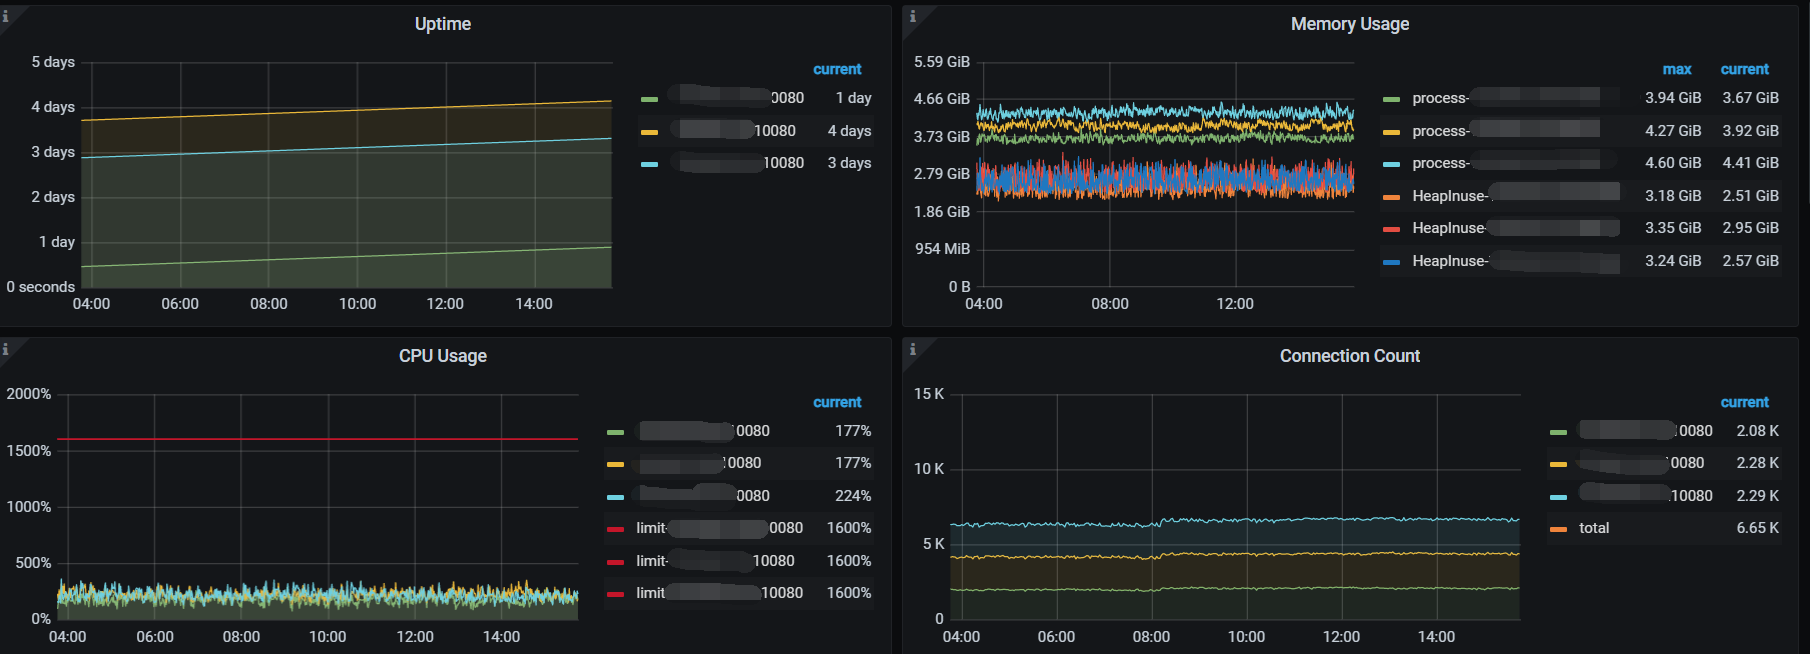
TiDB单节点内存持续升高,周期性oom


通过内存分析,定位到一些问题,RowSampleCollectorAnalyzeColumnsExec的内存消耗占比占80%以上,也就是说主要内存消耗在analyze统计信息的获取上面

(pprof) top 
Showing nodes accounting for 14582.34MB, 89.52% of 16289.01MB total
Dropped 1250 nodes (cum <= 81.45MB)
Showing top 10 nodes out of 53
      flat  flat%   sum%        cum   cum%
 8852.69MB 54.35% 54.35%  8852.69MB 54.35%  github.com/pingcap/tidb/statistics.(*RowSampleCollector).FromProto
 4144.93MB 25.45% 79.79% 13286.68MB 81.57%  github.com/pingcap/tidb/executor.(*AnalyzeColumnsExec).subMergeWorker
  953.54MB  5.85% 85.65%   955.04MB  5.86%  github.com/pingcap/tidb/store/copr.(*copIteratorWorker).handleCopResponse
  289.07MB  1.77% 87.42%   289.07MB  1.77%  github.com/pingcap/tidb/statistics.(*FMSketch).insertHashValue
  185.85MB  1.14% 88.56%   185.85MB  1.14%  github.com/pingcap/tidb/executor.getOneLine
   84.57MB  0.52% 89.08%    84.57MB  0.52%  bytes.makeSlice
   60.04MB  0.37% 89.45%   153.48MB  0.94%  github.com/pingcap/tidb/table/tables.(*TableCommon).UpdateRecord
    4.50MB 0.028% 89.48%   383.46MB  2.35%  github.com/pingcap/tidb/executor.(*Compiler).Compile
    3.66MB 0.022% 89.50%   104.05MB  0.64%  github.com/pingcap/tidb/executor.(*tableWorker).executeTask
    3.50MB 0.021% 89.52%   100.01MB  0.61%  github.com/pingcap/tidb/util/ranger.(*rangeDetacher).detachCNFCondAndBuildRangeForIndex

analyze相关参数SHOW VARIABLES LIKE '%analyze%'

tidb_analyze_version	2
tidb_auto_analyze_end_time	21:00 +0000
tidb_auto_analyze_ratio	0.5
tidb_auto_analyze_start_time	18:00 +0000
tidb_enable_fast_analyze	OFF

TiDB日志有相关analyze报错,显示analyze操作时间超过GC life time,导致analyze操作失败,非auto_analyze时间重试,导致内存泄漏

[2022/04/20 14:54:31.216 +08:00] [ERROR] [analyze.go:146] ["analyze failed"] [error="[tikv:9006]GC life time is shorter than transaction duration, transaction starts at 2022-04-20 14:17:31.474 +0800 CST, GC safe point is 2022-04-20 14:20:29.924 +0800 CST"]
[2022/04/20 14:54:31.216 +08:00] [INFO] [analyze.go:128] ["analyze table `db1`.`t1` has failed"] [partition=] ["job info"="auto analyze table"] ["start time"=2022/04/20 14:17:31.517 +08:00] ["end time"=2022/04/20 14:54:31.216 +08:00] [cost=36m59.698492441s]
[2022/04/20 14:54:31.216 +08:00] [INFO] [tidb.go:242] ["rollbackTxn called due to ddl/autocommit failure"]
[2022/04/20 14:54:31.216 +08:00] [WARN] [session.go:1683] ["run statement failed"] [schemaVersion=557] [error="[tikv:9006]GC life time is shorter than transaction duration, transaction starts at 2022-04-20 14:17:31.474 +0800 CST, GC safe point is 2022-04-20 14:20:29.924 +0800 CST"] [session="{\
  \"currDBName\": \"\",\
  \"id\": 0,\
  \"status\": 2,\
  \"strictMode\": true,\
  \"user\": null\
}"]
[2022/04/20 14:54:31.216 +08:00] [ERROR] [update.go:1085] ["[stats] auto analyze failed"] [sql="analyze table %n.%nindex %n"] [cost_time=36m59.704161336s] [error="[tikv:9006]GC life time is shorter than transaction duration, transaction starts at 2022-04-20 14:17:31.474 +0800 CST, GC safe point is 2022-04-20 14:20:29.924 +0800 CST"]

GC相关参数SHOW VARIABLES LIKE '%gc%',tidb_gc_life_time已经调整为30min

tidb_gc_concurrency	-1
tidb_gc_enable	ON
tidb_gc_life_time	30m0s
tidb_gc_run_interval	10m0s
tidb_gc_scan_lock_mode	LEGACY

查看analyze失败的表数据,SELECT * FROM INFORMATION_SCHEMA.TABLES WHERE table_name='t1',数据行数不准确估计有4~5亿

TABLE_CATALOG	TABLE_SCHEMA	TABLE_NAME	TABLE_TYPE	ENGINE	VERSION	ROW_FORMAT	TABLE_ROWS	AVG_ROW_LENGTH	DATA_LENGTH	MAX_DATA_LENGTH	INDEX_LENGTH	DATA_FREE	AUTO_INCREMENT	CREATE_TIME	UPDATE_TIME	CHECK_TIME	TABLE_COLLATION	CHECKSUM	CREATE_OPTIONS	TABLE_COMMENT	TIDB_TABLE_ID	TIDB_ROW_ID_SHARDING_INFO	TIDB_PK_TYPE
def	            db1               t1        BASE TABLE	InnoDB	10	     Compact	 447487020	  678	303842721774	0	193638835755	0	116096911662	1/4/2022 11:13:03			utf8mb4_bin				130	NOT_SHARDED(PK_IS_HANDLE)	CLUSTERED

【附件】

pprof.tidb-server.alloc_objects.alloc_space.inuse_objects.inuse_space.001.pb.gz (1.6 MB)

Hi, 可以参考一下这篇文档可以帮助你了解原因。建议将 tidb_analyze_version 调整为 1 ,目前 tidb_analyze_version =2 时实验特性。https://docs.pingcap.com/zh/tidb/v5.2/statistics#统计信息简介

2 个赞

好的,将 tidb_analyze_version 调整为 1了,另外,日志中还有analyze worker panicked的报错

[2022/04/20 18:51:36.438 +08:00] [ERROR] [analyze.go:1235] ["analyze worker panicked"] [stack="goroutine 2641676930 [running]:\
github.com/pingcap/tidb/executor.(*AnalyzeColumnsExec).subBuildWorker.func1(0xc74ea64000, 0xc7d94a4d80, 0x1)\
\t/home/jenkins/agent/workspace/optimization-build-tidb-linux-amd/go/src/github.com/pingcap/tidb/executor/analyze.go:1233 +0x105\
panic(0x38ffc20, 0xc3bc9e4000)\
\t/usr/local/go/src/runtime/panic.go:965 +0x1b9\
github.com/pingcap/tidb/util/chunk.(*Column).getNameValue(0xc7c180e000, 0x1, 0x7f5895cceb00, 0x2031f000000000, 0xc064c6d730)\
\t/home/jenkins/agent/workspace/optimization-build-tidb-linux-amd/go/src/github.com/pingcap/tidb/util/chunk/column.go:572 +0x1a8\
github.com/pingcap/tidb/util/chunk.(*Column).GetEnum(...)\
\t/home/jenkins/agent/workspace/optimization-build-tidb-linux-amd/go/src/github.com/pingcap/tidb/util/chunk/column.go:544\
github.com/pingcap/tidb/util/chunk.Row.GetEnum(0xc7c180a000, 0x1, 0x0, 0xc7c180c003, 0xc5956361e0, 0x7f588b4c2648)\
\t/home/jenkins/agent/workspace/optimization-build-tidb-linux-amd/go/src/github.com/pingcap/tidb/util/chunk/row.go:96 +0x4b\
github.com/pingcap/tidb/util/chunk.Row.GetDatum(0xc7c180a000, 0x1, 0x0, 0xc7c18075c0, 0x0, 0x0, 0x0, 0x0, 0x0, 0x0, ...)\
\t/home/jenkins/agent/workspace/optimization-build-tidb-linux-amd/go/src/github.com/pingcap/tidb/util/chunk/row.go:180 +0xa7c\
github.com/pingcap/tidb/statistics.(*Histogram).GetUpper(0xc7c180e070, 0x0, 0xc7bef9e000)\
\t/home/jenkins/agent/workspace/optimization-build-tidb-linux-amd/go/src/github.com/pingcap/tidb/statistics/histogram.go:123 +0x9e\
github.com/pingcap/tidb/statistics.buildHist(0xc5b0894900, 0xc7c180e070, 0xc8d51fe000, 0x186a0, 0x186a0, 0xb969fb, 0x1, 0x100, 0x0, 0xc813e49cb0, ...)\
\t/home/jenkins/agent/workspace/optimization-build-tidb-linux-amd/go/src/github.com/pingcap/tidb/statistics/builder.go:160 +0x169\
github.com/pingcap/tidb/statistics.BuildHistAndTopN(0x40773d8, 0xc130993800, 0x100, 0x1f4, 0xf, 0xc7c1807560, 0xc0015e8be8, 0x11f7f01, 0xc7b9b88070, 0xc7bd486000, ...)\
\t/home/jenkins/agent/workspace/optimization-build-tidb-linux-amd/go/src/github.com/pingcap/tidb/statistics/builder.go:364 +0x12cd\
github.com/pingcap/tidb/executor.(*AnalyzeColumnsExec).subBuildWorker(0xc7d94a4d80, 0xc74ea64000, 0xc74ea64060, 0xc74ea58000, 0x17, 0x17, 0xc74ea580c0, 0x17, 0x17, 0xc74ea6c000, ...)\
\t/home/jenkins/agent/workspace/optimization-build-tidb-linux-amd/go/src/github.com/pingcap/tidb/executor/analyze.go:1330 +0x8b7\
created by github.com/pingcap/tidb/executor.(*AnalyzeColumnsExec).buildSamplingStats\
\t/home/jenkins/agent/workspace/optimization-build-tidb-linux-amd/go/src/github.com/pingcap/tidb/executor/analyze.go:930 +0x10f2\
"]
[2022/04/20 18:51:36.438 +08:00] [INFO] [analyze.go:128] ["analyze table `amz_listing`.`request_report_result` has failed"] [partition=] ["job info"="auto analyze table"] ["start time"=2022/04/20 18:48:04.666 +08:00] ["end time"=2022/04/20 18:51:36.438 +08:00] [cost=3m31.772018774s]
[2022/04/20 18:51:36.438 +08:00] [INFO] [tidb.go:242] ["rollbackTxn called due to ddl/autocommit failure"]
[2022/04/20 18:51:36.438 +08:00] [WARN] [session.go:1683] ["run statement failed"] [schemaVersion=557] [error="analyze worker panic"] [session="{\
  \"currDBName\": \"\",\
  \"id\": 0,\
  \"status\": 2,\
  \"strictMode\": true,\
  \"user\": null\
}"]
[2022/04/20 18:51:36.438 +08:00] [ERROR] [update.go:1085] ["[stats] auto analyze failed"] [sql="analyze table %n.%nindex %n"] [cost_time=3m32.01758695s] [error="analyze worker panic"]
[2022/04/20 18:51:36.441 +08:00] [INFO] [update.go:1004] ["[stats] auto analyze for unanalyzed"] [sql="analyze table `amz_listing`.`request_report_result`"]


image
按照官方的文档,修改tidb_analyze_version为1之后,将 tidb_enable_fast_analyze 设置为 1 来打开快速分析功能,并使用以下 SQL 语句生成 DROP STATS 的语句并执行

select distinct(concat('DROP STATS ',table_schema, '.', table_name,';')) from information_schema.tables, mysql.stats_histograms where stats_ver = 2 and table_id = tidb_table_id ;

目前观察来看,TiDB节点负载和内存消耗平均,日志中也没有相关analyze的报错信息

此话题已在最后回复的 1 分钟后被自动关闭。不再允许新回复。