作者:Kennytm Chen 、Rick lee
文档目的
Grafana Metrics 页面是我们日常解决 TiDB 问题时非常依赖的一个工具,本文档提供了一种方法,让大家可以较为方便地导出和导入 Grafana Metrics 页面。
【注意事项】
-
适用于 Chrome / Edge / Firefox 浏览器;
-
为保证导出的监控数据的完整性,在导出 Grafana 页面前请确保浏览器已经加载好全部的图表。
-
由于脚本迭代更新较快,在使用过程中若遇到问题,请参考最新的脚本链接:https://metricstool.pingcap.com/
导出 Grafana 数据为快照
导出步骤:
- 拷贝下面代码
/* Copyright 2020 PingCAP, Inc. Licensed under MIT. */
!function(){"use strict"
const t={"en-US":{t:"Script failed to run. Please ensure it is running on the Grafana v6.x.x dashboard page.",
i:"Going to export snapshot of the current dashboard: ",s:"Note: Only metrics from visible panels can be exported",
o:"Number of panels",l:"Loading panels",h:"Expand all rows",p:"Export",u:"Export immediately",cancel:"Cancel"},"zh-TW":{
t:"执行失败。请确保是在 Grafana v6.x.x 的仪表板上执行脚本。",i:"即将导出当前仪表板:",s:"注意:只能导出已展开的面板內的资料",o:"面板数量",l:"载入面板中",h:"展开所有面板",p:"导出",
u:"立即导出",cancel:"取消"},"zh-CN":{t:"执行失败。请确保是在 Grafana v6.x.x 的监控网页上执行脚本。",i:"将导出当前的监控页面:",s:"注意:只有已展开面板内的监控会被导出",
o:"面板数量",l:"加载面板中",h:"展开所有面板",p:"导出",u:"立刻导出",cancel:"取消"}}[function(){const t=navigator.language
return/^zh-/.test(t)?/\b(TW|HK|MO|Hant)\b/.test(t)?"zh-TW":"zh-CN":"en-US"}()]
try{
const e=angular.element,i=document.styleSheets[0],s=[".__dexport_hint{z-index:2222;position:fixed;background:#fff;color:#000;padding:1em;font-size:18px;border-left:3px solid #faad14;right:0;top:5em;opacity:.8;min-width:30em}",".__dexport_hint:hover{opacity:1}",".__dexport_hint button{margin:0 1em}",".__dexport_hint button[disabled]{opacity:.5}",".__dexport_hint progress{margin-right:1em;vertical-align:middle;width:18em}"]
class n{constructor(){const n=e(document).injector()
this.m=n.get("timeSrv")
const o=this.m.dashboard
s.forEach(t=>i.insertRule(t,0)),this.g=e("<span>"),this._=e('<progress value="0">'),
this.v=e('<button style="font-weight:bold">').text(t.p).one("click",()=>this.P()),
this.S=e("<button>").text(t.h).on("click",()=>o.expandRows())
const a=/^(Mac|iP)/.test(navigator.platform)?"flex-direction:row-reverse":"justify-content:center"
this.$=e('<div class="__dexport_hint">').append(e("<p>").text(t.i).append(e("<strong>").text(o.title)),e("<p>").text(t.s).append(this.S),e('<p style="font-size:.8em">').append(this._,this.g),e(`<p style="display:flex;${a}">`).append(this.v,e("<button>").text(t.cancel).on("click",()=>this.T()))),
this.I=0,e(document.body).append(this.$),this.O=setInterval(()=>this.k(),500)}k(){const i=e(".panel-loading"),s=i.length
if(0===this.I)this.g.text(`${t.o}: ${s}`),this.v.prop("disabled",0===s)
else{const e=i.filter(".ng-hide").length,n=(100*e/s||0).toFixed(1)
this.g.text(`${t.l}: ${n}% (${e}/${s})`),this._.prop({value:e,max:s}),s>e?2!==this.I&&(this.I=2,
this.v.prop("disabled",!1).text(t.u).one("click",()=>this.N())):this.N()}}P(){const t=this.m.dashboard
this.I=1,this.v.prop("disabled",!0),this.U=t.refresh,this.m.setAutoRefresh(),e(".panel-loading").removeClass("ng-hide"),
t.snapshot={timestamp:new Date},t.startRefresh()}N(){
const t=this.m.dashboard,i=t.snapshot.timestamp.toISOString(),s=t.getSaveModelClone()
s.time=this.m.timeRange()
const n={meta:{isSnapshot:!0,type:"snapshot",expires:"9999-12-31T23:59:59Z",created:i},dashboard:s}
this.T()
const o=new Blob([JSON.stringify(n)],{type:"application/json"}),a=URL.createObjectURL(o),r=e("<a>")
r.prop({href:a,download:`${s.title}_${i}.json`}),e(document.body).append(r),r[0].click(),setTimeout(()=>{
URL.revokeObjectURL(a),r.remove()},0)}T(){const t=this.m.dashboard
delete t.snapshot,t.forEachPanel(t=>delete t.snapshotData),t.annotations.list.forEach(t=>delete t.snapshotData),
this.U&&this.m.setAutoRefresh(this.U),clearInterval(this.O),this.$.remove(),s.forEach(()=>i.deleteRule(0))}}new n
}catch(e){console.error(e),alert(t.t)}}()
-
打开需要导出的 Grafana 页面,进入开发者工具,将步骤 1 中的脚本拷贝到 “Console”
进入开发者工具快捷方式:
- Chrome 浏览器:F12;Ctrl+Shift+I (Windows) 或 Cmd+Opt+I (Mac)
- Edge 浏览器:F12
- Firefox 浏览器:F12;Ctrl+Shift+C (Windows) 或 Cmd+Opt+C (Mac)
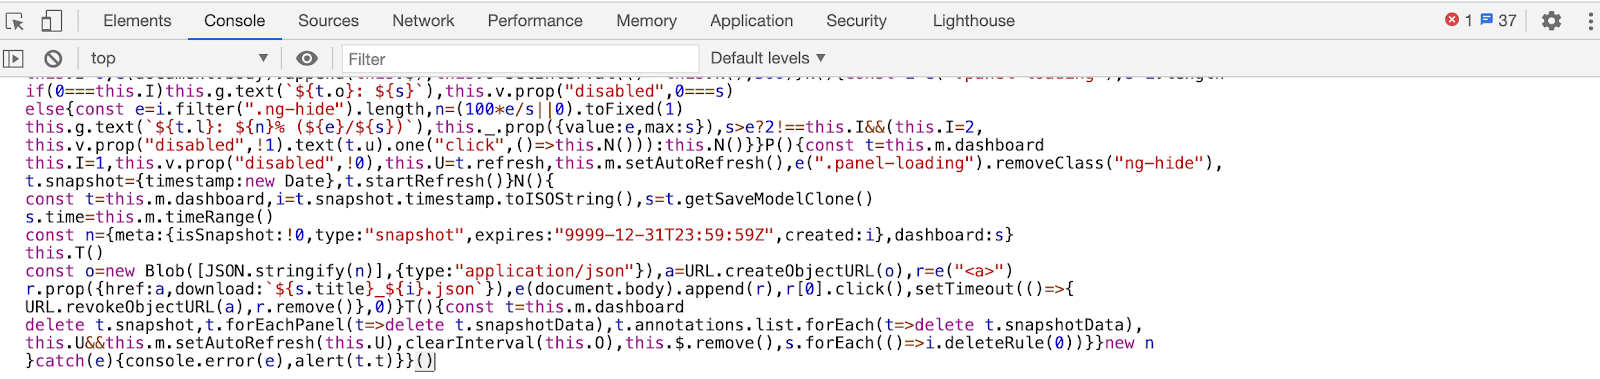
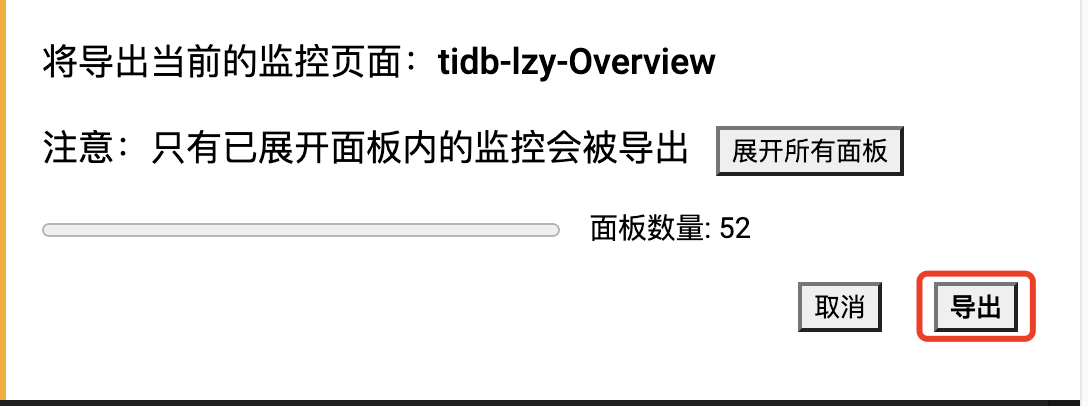
- 按下 回车 (Enter) 执行脚本,此时 Grafana 网页中会出现操作提示框,请遵循其指示进行后续操作
在线查看 Grafana 快照
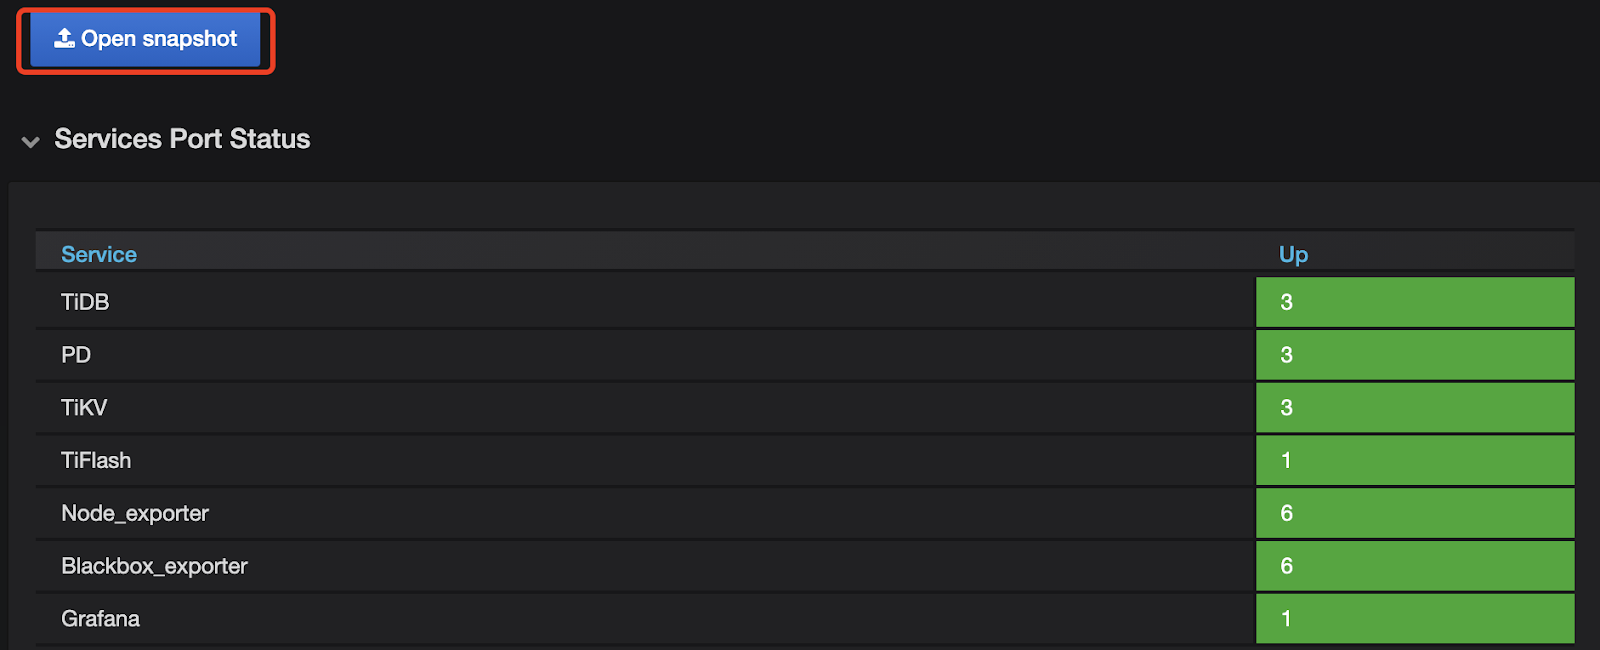
1.打开 https://metricstool.pingcap.com/viz/.
2.点击 “Open snapshot” ,选择之前导出的 snapshot 文件
将快照导入本地 Grafana
方式一、使用 cURL
1.准备好 Dashboard Snapshot 的 JSON 文件,记录好 Grafana URL、登录账号和密码。
2.执行下面的导入命令:
curl -H 'Content-Type: application/json' 'http://admin:admin@localhost:3000/api/snapshots' --data-binary @/root/snap1.json
参数说明
- http://admin:admin@localhost:3000 登录账号、密码和 Grafana server 的 IP 和 port
- /root/snap1.json 导入的 JSON 文件路径
3.导入完成后会输出类似下方的结果,直接打开末尾的 URL 即可查看 Grafana 页面
{"deleteKey":"8LvAhyp4oYgh2lxivj6b2Z1APDMS2azi",
 "deleteUrl":"http://localhost:3000/api/snapshots-delete/8LvAhyp4oYgh2lxivj6b2Z1APDMS2azi",
 "key":"icoOxTDyQx4j6XLc4TCwZTiTBbma6AAN",
 "url":"http://localhost:3000/dashboard/snapshot/icoOxTDyQx4j6XLc4TCwZTiTBbma6AAN"}
方式二、使用 Wget
1.准备好 Dashboard Snapshot 的 JSON 文件,记录好 Grafana URL,登录账号和密码。
2.执行下面的导入命令:
wget -qO- --header 'Content-Type: application/json' 'http://admin:admin@localhost:3000/api/snapshots' --post-file /root/snap1.json
参数说明
- http://admin:admin@localhost:3000 登录账号、密码和 Grafana server 的 IP 和 port
- /root/snap1.json 导入的 JSON 文件路径
3.导入完成后会输出类似下方的结果,直接打开末尾的 URL 即可查看 Grafana 页面
{"deleteKey":"8LvAhyp4oYgh2lxivj6b2Z1APDMS2azi",
 "deleteUrl":"http://localhost:3000/api/snapshots-delete/8LvAhyp4oYgh2lxivj6b2Z1APDMS2azi",
 "key":"icoOxTDyQx4j6XLc4TCwZTiTBbma6AAN",
 "url":"http://localhost:3000/dashboard/snapshot/icoOxTDyQx4j6XLc4TCwZTiTBbma6AAN"}
方式三、使用 grafsnap
1.下载 grafsnap 0.1.0 并在当前目录解压
wget https://github.com/kennytm/grafana-export/releases/download/v0.1.0/grafsnap-0.1.0-linux-x86_64.tar.gz
tar xfv grafsnap-0.1.0-linux-x86_64.tar.gz
2.准备好 Dashboard Snapshot 的 JSON 文件
3.执行导入命令
./grafsnap import -b 'http://localhost:3000/' -k 'admin:admin' ~/snap1.json ~/snap2.json
参数说明:
- -b ‘http://localhost:3000/’ Grafana server ip 和 port
- -k ‘admin:admin’ 登录账号和密码,可以使用 API Key
- ~/snap1.json ~/snap2.json 导入的 JSON 文件路径,可一次导入多个
4.导入完成后会输出类似下方的结果,直接打开末尾的 URL 即可查看 Grafana 页面
[
    {
        "file": "snap1.json",
        "url": "http://localhost:3000/dashboard/snapshot/94prEd89WqqawEJkujYit5aHHkqbkKWs"
    },
    {
        "file": "snap2.json",
        "url": "http://localhost:3000/dashboard/snapshot/b4wJAg4OQ9t6yTddpawF6cImiG2MVpt2"
    }
]