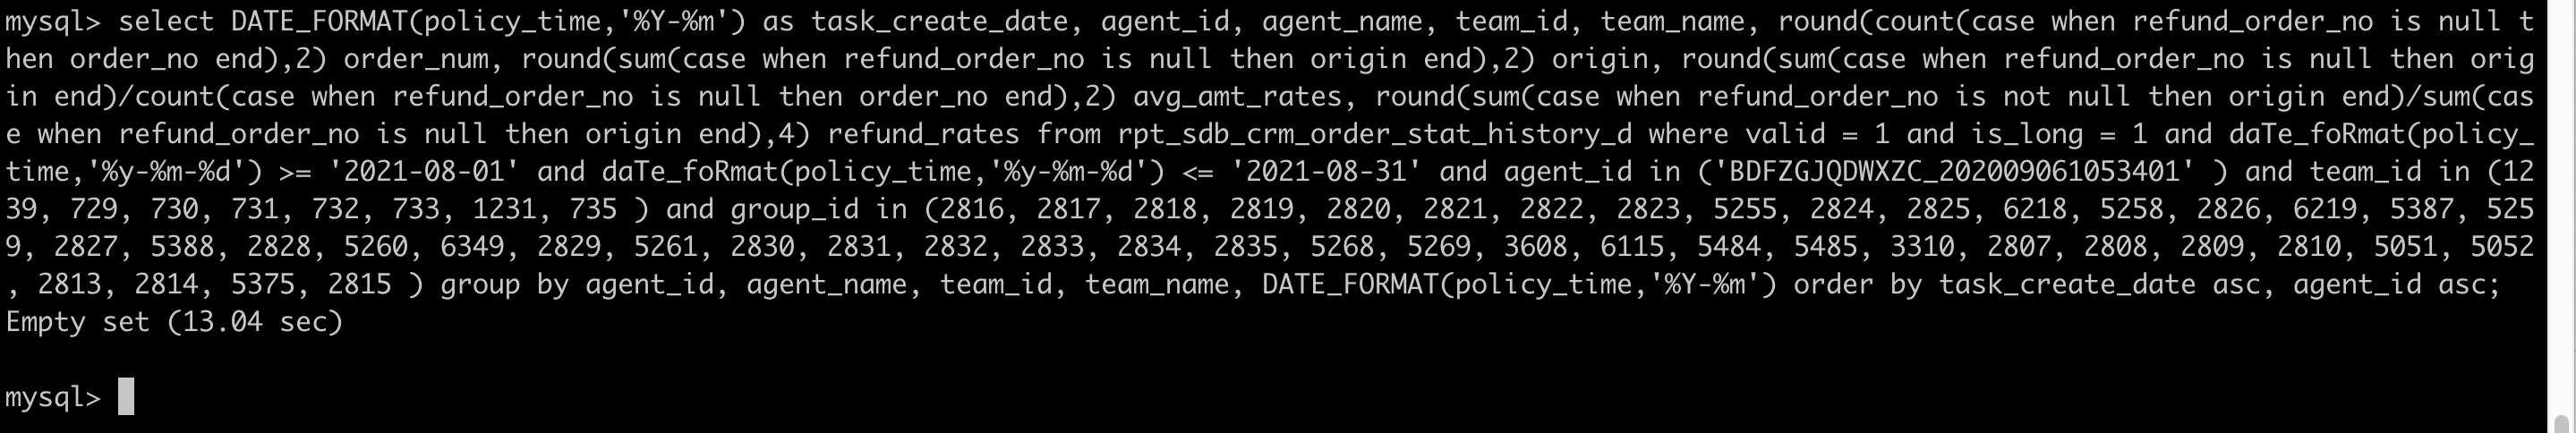
- 发现最慢的查询都是同一个 sql。请问这条 sql 平时查询性能如何?是一直这么慢还是只有出问题的时间段才慢?
select DATE_FORMAT(policy_time,’%Y-%m’) as task_create_date, agent_id, agent_name, team_id, team_name, round(count(case when refund_order_no is null then order_no end),2) order_num, round(sum(case when refund_order_no is null then origin end),2) origin, round(sum(case when refund_order_no is null then origin end)/count(case when refund_order_no is null then order_no end),2) avg_amt_rates, round(sum(case when refund_order_no is not null then origin end)/sum(case when refund_order_no is null then origin end),4) refund_rates from rpt_sdb_crm_order_stat_history_d where valid = 1 and is_long = 1 and daTe_foRmat(policy_time,’%y-%m-%d’) >= ‘2021-08-01’ and daTe_foRmat(policy_time,’%y-%m-%d’) <= ‘2021-08-31’ and agent_id in (‘BDFZGJQDWXZC_202009061053401’ ) and team_id in (1239, 729, 730, 731, 732, 733, 1231, 735 ) and group_id in (2816, 2817, 2818, 2819, 2820, 2821, 2822, 2823, 5255, 2824, 2825, 6218, 5258, 2826, 6219, 5387, 5259, 2827, 5388, 2828, 5260, 6349, 2829, 5261, 2830, 2831, 2832, 2833, 2834, 2835, 5268, 5269, 3608, 6115, 5484, 5485, 3310, 2807, 2808, 2809, 2810, 5051, 5052, 2813, 2814, 5375, 2815 ) group by agent_id, agent_name, team_id, team_name, DATE_FORMAT(policy_time,’%Y-%m’) order by task_create_date asc, agent_id asc;
- 看看这台机器的 cpu mode 与其他节点的差异:
cat /sys/devices/system/cpu/cpu*/cpufreq/scaling_governor