【TiDB 使用环境】生产环境
【TiDB 版本】7.5.1
【操作系统】centos7.9
【部署方式】云上部署(什么云)/机器部署(什么机器配置、什么硬盘)
建表
CREATE TABLE test_nocluster_info (
id bigint(20) NOT NULL AUTO_INCREMENT COMMENT ‘label:主键ID’,
info_id bigint(20) NOT NULL COMMENT ‘aaa’,
KEY test (info_id),
PRIMARY KEY (id) /*T![clustered_index] NONCLUSTERED */
) ENGINE=InnoDB DEFAULT CHARSET=utf8mb4 COLLATE=utf8mb4_general_ci COMMENT=‘test’;
写入
insert into test_nocluster_info values(1,1),(2,2),(3,3);
MySQL [test]> explain analyze select count(1) from test_nocluster_info where info_id=3;
+---------------------------+---------+---------+-----------+------------------------------------------------+-------------------------------------------------------------------------------------------------------------------------------------------------------------------------------------------------------------------------------------+---------------------------------------------+-----------+------+
| id | estRows | actRows | task | access object | execution info | operator info | memory | disk |
+---------------------------+---------+---------+-----------+------------------------------------------------+-------------------------------------------------------------------------------------------------------------------------------------------------------------------------------------------------------------------------------------+---------------------------------------------+-----------+------+
| StreamAgg_10 | 1.00 | 1 | root | | time:497.4µs, loops:2, RU:0.504593 | funcs:count(1)->Column#4 | 388 Bytes | N/A |
| └─IndexReader_15 | 0.00 | 1 | root | | time:490.5µs, loops:2, cop_task: {num: 1, max: 439.4µs, proc_keys: 1, tot_proc: 86.7µs, tot_wait: 38.5µs, rpc_num: 1, rpc_time: 424.3µs, copr_cache_hit_ratio: 0.00, build_task_duration: 15.7µs, max_distsql_concurrency: 1} | index:IndexRangeScan_14 | 258 Bytes | N/A |
| └─IndexRangeScan_14 | 0.00 | 1 | cop[tikv] | table:test_nocluster_info, index:test(info_id) | tikv_task:{time:0s, loops:1}, scan_detail: {total_process_keys: 1, total_process_keys_size: 46, total_keys: 2, get_snapshot_time: 16.3µs, rocksdb: {key_skipped_count: 1, block: {cache_hit_count: 7}}} | range:[3,3], keep order:false, stats:pseudo | N/A | N/A |
+---------------------------+---------+---------+-----------+------------------------------------------------+-------------------------------------------------------------------------------------------------------------------------------------------------------------------------------------------------------------------------------------+---------------------------------------------+-----------+------+
3 rows in set (0.00 sec)
MySQL [test]> explain analyze select count(id) from test_nocluster_info where info_id=3;
+----------------------------------+---------+---------+-----------+------------------------------------------------+---------------------------------------------------------------------------------------------------------------------------------------------------------------------------------------------------------------------------------------------------------------------------------------------------------------------------------------------------------------------------------------------------------------------------------------------------+---------------------------------------------------------------------+-----------+------+
| id | estRows | actRows | task | access object | execution info | operator info | memory | disk |
+----------------------------------+---------+---------+-----------+------------------------------------------------+---------------------------------------------------------------------------------------------------------------------------------------------------------------------------------------------------------------------------------------------------------------------------------------------------------------------------------------------------------------------------------------------------------------------------------------------------+---------------------------------------------------------------------+-----------+------+
| StreamAgg_10 | 1.00 | 1 | root | | time:1.14ms, loops:2, RU:1.010787 | funcs:count(test.test_nocluster_info.id)->Column#4 | 768 Bytes | N/A |
| └─IndexLookUp_24 | 0.00 | 1 | root | | time:1.14ms, loops:2, index_task: {total_time: 489.1µs, fetch_handle: 486.6µs, build: 866ns, wait: 1.56µs}, table_task: {total_time: 542.5µs, num: 1, concurrency: 5}, next: {wait_index: 581.5µs, wait_table_lookup_build: 50.8µs, wait_table_lookup_resp: 487.5µs} | | 8.76 KB | N/A |
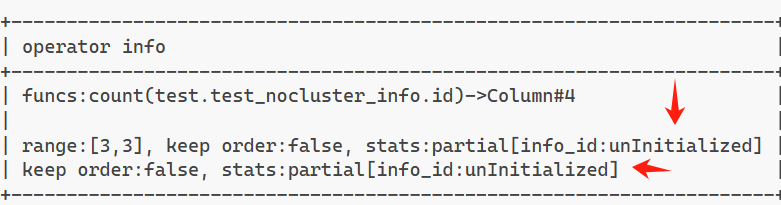
| ├─IndexRangeScan_22(Build) | 0.00 | 1 | cop[tikv] | table:test_nocluster_info, index:test(info_id) | time:474.5µs, loops:3, cop_task: {num: 1, max: 423.2µs, proc_keys: 1, tot_proc: 94.5µs, tot_wait: 49.7µs, rpc_num: 1, rpc_time: 404.1µs, copr_cache_hit_ratio: 0.00, build_task_duration: 18µs, max_distsql_concurrency: 1}, tikv_task:{time:0s, loops:1}, scan_detail: {total_process_keys: 1, total_process_keys_size: 46, total_keys: 2, get_snapshot_time: 26.2µs, rocksdb: {key_skipped_count: 1, block: {cache_hit_count: 7}}} | range:[3,3], keep order:false, stats:partial[info_id:unInitialized] | N/A | N/A |
| └─TableRowIDScan_23(Probe) | 0.00 | 1 | cop[tikv] | table:test_nocluster_info | time:466.8µs, loops:2, cop_task: {num: 1, max: 423.5µs, proc_keys: 1, tot_proc: 83.9µs, tot_wait: 47.1µs, rpc_num: 1, rpc_time: 407.4µs, copr_cache_hit_ratio: 0.00, build_task_duration: 24.1µs, max_distsql_concurrency: 1, max_extra_concurrency: 1}, tikv_task:{time:0s, loops:1}, scan_detail: {total_process_keys: 1, total_process_keys_size: 41, total_keys: 1, get_snapshot_time: 25.5µs, rocksdb: {block: {cache_hit_count: 7}}} | keep order:false, stats:partial[info_id:unInitialized] | N/A | N/A |
+----------------------------------+---------+---------+-----------+------------------------------------------------+---------------------------------------------------------------------------------------------------------------------------------------------------------------------------------------------------------------------------------------------------------------------------------------------------------------------------------------------------------------------------------------------------------------------------------------------------+---------------------------------------------------------------------+-----------+------+
可以看到select count(1)的执行计划要明显优于select count(id),不太清楚是否算bug