v7.1.2
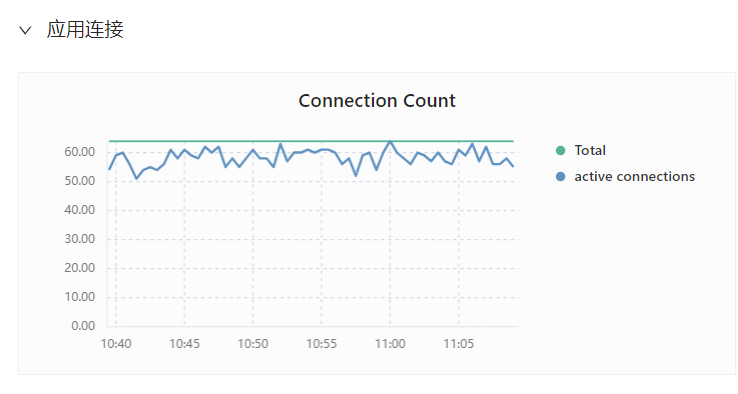
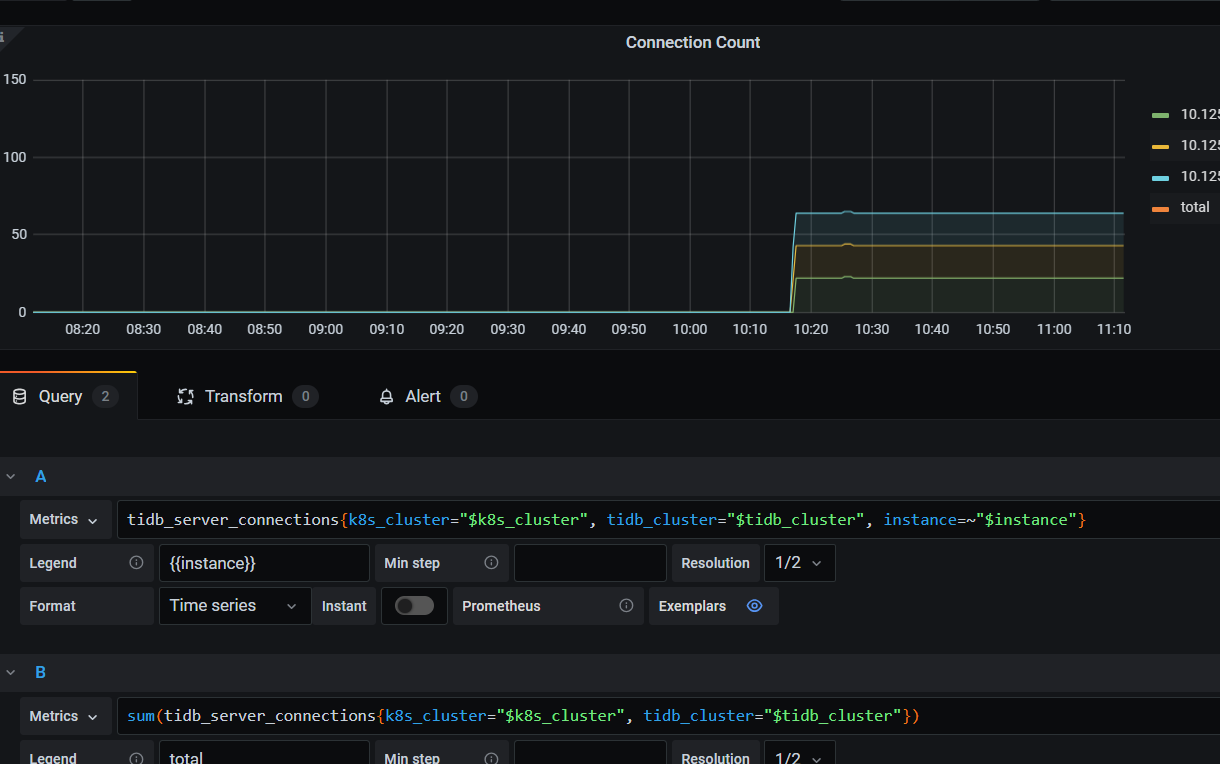
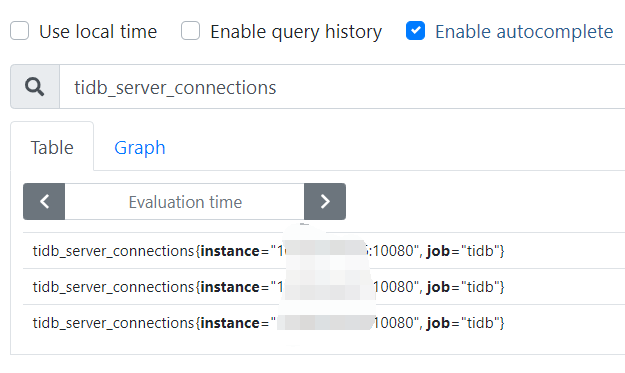
dashboard中的监控有acitve connection,但是grafana里的连接监控没有active 的统计。再普罗里没找到有单独存储active connection的指标。
v7.1.2
dashboard中的监控有acitve connection,但是grafana里的连接监控没有active 的统计。再普罗里没找到有单独存储active connection的指标。
不会是select count(*) from information_schema.processlist where Command !=‘Sleep’;这样计算出来的吧?
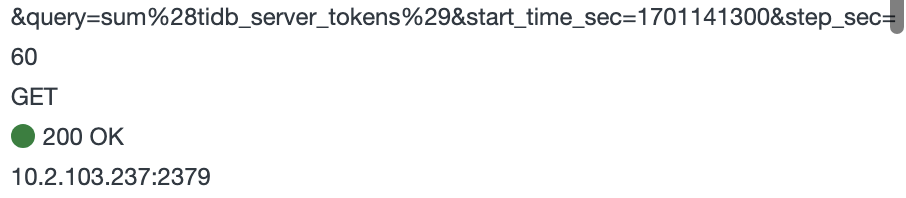
![]() 那就是根据获取到的token来计算的
那就是根据获取到的token来计算的
信息不同步也有可能
此话题已在最后回复的 60 天后被自动关闭。不再允许新回复。