多台 TiDB 集群监控整合

为提高效率,提问时请尽量提供详细背景信息,问题描述清晰可优先响应。以下信息点请尽量提供:

  • 系统版本 & kernel 版本】 centos7
  • TiDB 版本】3.0.4
  • 磁盘型号
  • 集群节点分布】3
  • 数据量 & region 数量 & 副本数
  • 问题描述(我做了什么)】我要部署三套tidb集群,但是我希望用一套监控平台,但是现在的ansible部署脚本里面,inventory.ini 的配置只能指定部署monitoring_servers、grafana_servers,比如我第一个集群部署的时候把监控和grafana一起部署了,我部署第二套集群的时候,让我配置用那个monitoring和grafana节点,而不是在部署一套monitoring和grafana
  • 关键词】 监控整合
1 个赞

grafana 可以共用一套参考:https://asktug.com/t/dm/571。正常部署情况下 monitoring_servers 即 prometheus 组件需要各有一套

明白了,谢谢。

假设 集群1 和 集群2 共用一个 grafana 监控,集群1 已经部署好了。 1、local_prepare、bootstrap、deploy 阶段,集群2 inventory.ini 中注释掉 grafana_servers 组下面的 ip(注:inventory.ini 中的 grafana 用户名密码假设已经是一样的) 2、在执行 start.yml 之前取消 grafana_servers 组中 ip 的注释,然后执行 start.yml,这个一般直接报错,原因是在 grafana 中没有生成 集群2 的 prometheus 数据源 3、手动在 grafana 中添加 集群2 的数据源,然后在 tidb-ansible/scripts 目录下执行 python2 grafana-config-copy.py

执行完python2 grafana-config-copy.py,我grafana上集群1的图表都不见了,这个如何找回来呢

报表导入会进行 replace 操作,所以报表名称不能相同,即集群名称不能相同。

集群名称是不同的,一个是 ontest-cluster,一个是tidb-cluster-prod,
在 ontest-cluster这个集群上执行python2 grafana-config-copy.py, grafana 的图表就会被覆盖成ontest-cluster的;在tidb-cluster-prod集群上执行python2 grafana-config-copy.py,grafana 的图表就会被覆盖成tidb-cluster-prod的

请完善下操作流程的说明

目的: 我有ontest-cluster、tidb-cluster-prod两个独立集群,我希望从tidb-cluster-prod的grafana可以查看ontest-cluster集群的监控,也就是把ontest-cluster的监控整合到tidb-cluster-prod 步骤1: 独立部署集群名称为“ontest-cluster”的集群 步骤2: 独立部署集群名称为“tidb-cluster-prod”的集群 步骤3: 在tidb-cluster-prod集群的grafana上添加ontest-cluster集群的数据源 步骤4: 停止ontest-cluster集群, 执行ansible-playbook stop.yml 步骤5: 修改 ontest-cluster集群的inventory.ini 文件,将grafana_servers和alertmanager_servers改成tidb-cluster-prod集群的地址 步骤6: 启动ontest-cluster集群, 执行ansible-playbook start.yml 结果: tidb-cluster-prod集群的grafana图表被ontest-cluster覆盖

步骤7: 在tidb-cluster-prod上执行python2 grafana-config-copy.py,tidb-cluster-prod集群的grafana里面ontest-cluster的图表又会被tidb-cluster-prod覆盖

建议比较下两套环境的 tidb-ansible/scripts/dests.json 的文件里每个变量的名称以及 value 是否冲突了~~~

变量名称应该是相同的嘛,value不同,如下:

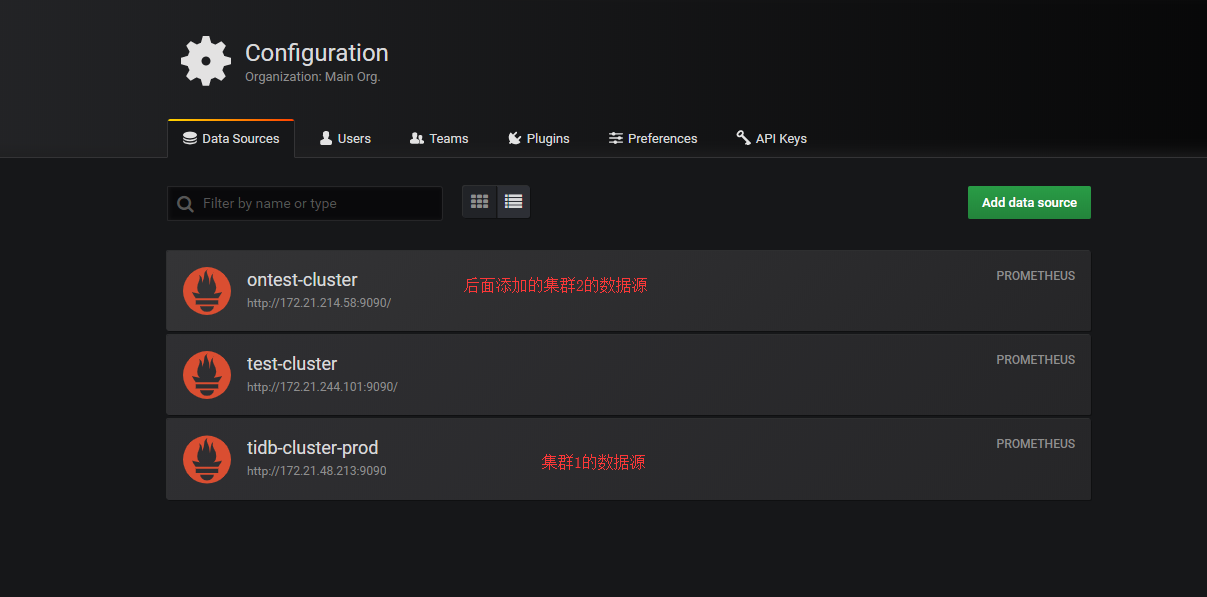
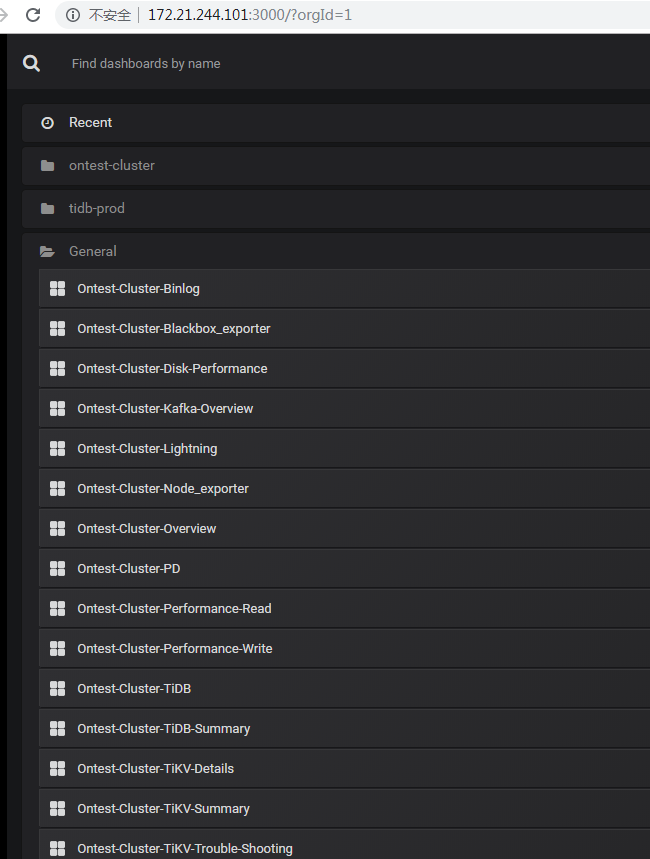
[{“apikey”: “eyJrIjoiR3R5aVAwWTRqckVPZDdRWWVtd2YzcG02NXV0NVhnTVciLCJuIjoiZ3JhZmFuYV9hcGlrZXkiLCJpZCI6MX0=”, “name”: “Ontest-Cluster”, “url”: “http://172.21.244.101:3000/”, “titles”: {“node”: “Ontest-Cluster-Node_exporter”, “binlog”: “Ontest-Cluster-Binlog”, “tikv_summary”: “Ontest-Cluster-TiKV-Summary”, “performance_read”: “Ontest-Cluster-Performance-Read”, “tidb_summary”: “Ontest-Cluster-TiDB-Summary”, “overview”: “Ontest-Cluster-Overview”, “performance_write”: “Ontest-Cluster-Performance-Write”, “disk_performance”: “Ontest-Cluster-Disk-Performance”, “tikv_details”: “Ontest-Cluster-TiKV-Details”, “lightning”: “Ontest-Cluster-Lightning”, “tikv_trouble_shot”: “Ontest-Cluster-TiKV-Trouble-Shooting”, “blackbox_exporter”: “Ontest-Cluster-Blackbox_exporter”, “pd”: “Ontest-Cluster-PD”, “tidb”: “Ontest-Cluster-TiDB”, “kafka_overview”: “Ontest-Cluster-Kafka-Overview”}, “user”: “admin”, “password”: “xxxx”, “datasource”: “ontest-cluster”}]

[{“apikey”: “eyJrIjoiWUl2cVdjZ0VVQ0pod2pTNVZ5QzhpUW53WWVJVld0cVYiLCJuIjoiZ3JhZmFuYV9hcGlrZXkiLCJpZCI6MX0=”, “name”: “Tidb-Cluster-Prod”, “url”: “http://172.21.244.101:3000/”, “titles”: {“node”: “Tidb-Cluster-Prod-Node_exporter”, “binlog”: “Tidb-Cluster-Prod-Binlog”, “tikv_summary”: “Tidb-Cluster-Prod-TiKV-Summary”, “performance_read”: “Tidb-Cluster-Prod-Performance-Read”, “tidb_summary”: “Tidb-Cluster-Prod-TiDB-Summary”, “overview”: “Tidb-Cluster-Prod-Overview”, “performance_write”: “Tidb-Cluster-Prod-Performance-Write”, “disk_performance”: “Tidb-Cluster-Prod-Disk-Performance”, “tikv_details”: “Tidb-Cluster-Prod-TiKV-Details”, “lightning”: “Tidb-Cluster-Prod-Lightning”, “tikv_trouble_shot”: “Tidb-Cluster-Prod-TiKV-Trouble-Shooting”, “blackbox_exporter”: “Tidb-Cluster-Prod-Blackbox_exporter”, “pd”: “Tidb-Cluster-Prod-PD”, “tidb”: “Tidb-Cluster-Prod-TiDB”, “kafka_overview”: “Tidb-Cluster-Prod-Kafka-Overview”}, “user”: “admin”, “password”: “xxx”, “datasource”: “tidb-cluster-prod”}]

grafana 合并两套集群操作步骤如下:

1,集群 1 安装 grafana 环境导入集群 1 的 dests.json

2,集群 2 不安装 grafana,但是在 start.yml 的时候配置集群 1 的 grafana 的地址和端口,此时会使用集群 2 的 dests.json 导入集群 2 的模版(此时集群 1 的 grafana 是启动的状态)

另外,请将集群 2 start.yml 前后的 grafana web 的数据源部分的截图发下~~~

这个是数据源

集群2启动之后直接把集群1的图表都覆盖了


然后在集群1上执行 python grafana-config-copy.py,集群1的图表配置就又覆盖了集群2的

可以将一个 dashboard 模板导出 json 文件,修改下其中的 datasource、title,去掉最后面的 uid,然后重新导入试一下;从使用 tidb-ansible 管理上不推荐一个 grafana 管理多个集群,后面也没有计划支持这种方式。

好的,如果不支持,那我就不折腾了,想其他办法,谢谢。

grafana用admin用户登陆进去,新建ORG,然后倒入对应的ORG就行了。可以切换ORG来达到一个grafana展示多个集群数据。。。。不知道满足不满足你的需求

多谢,已经有解决方案了

操作步骤:
1、完全按官方操作手册ansible安装集群1
2、安装集群2,在local_prepare、bootstrap、deploy 阶段, inventory.ini 中注释掉 grafana_servers 组下面的 ip

3、在执行集群2 start.yml 之前取消 grafana_servers 组中 ip 的注释,然后执行 start.yml

4、手动在 grafana 中添加集群2的数据源

5、修改/home/tidb/集群2/scripts目录下的所有json文件,修改uid的value,比如后面加几个数字,确保别和grafana中已经有的图表的uid冲突就行

6、在/home/tidb/集群2目录下执行python2 grafana-config-copy.py 即可完成两个集群的grafana整合

4 个赞

:+1::+1::+1::+1:

正是我想问的问题 ,赞赞赞

此话题已在最后回复的 1 分钟后被自动关闭。不再允许新回复。