ansible版本:ansible 2.7.11 tidb版本:3.0.0 磁盘信息如下: Disk /dev/vda: 64.4 GB, 64424509440 bytes, 125829120 sectors Units = sectors of 1 * 512 = 512 bytes Sector size (logical/physical): 512 bytes / 512 bytes I/O size (minimum/optimal): 512 bytes / 512 bytes Disk label type: dos Disk identifier: 0x000b1b45
Device Boot Start End Blocks Id System /dev/vda1 * 2048 125829086 62913519+ 83 Linux
Disk /dev/vdb: 536.9 GB, 536870912000 bytes, 1048576000 sectors Units = sectors of 1 * 512 = 512 bytes Sector size (logical/physical): 512 bytes / 512 bytes I/O size (minimum/optimal): 512 bytes / 512 bytes Disk label type: dos Disk identifier: 0x86510a1f
Device Boot Start End Blocks Id System /dev/vdb1 2048 1048575999 524286976 8e Linux LVM
Disk /dev/mapper/vgdata-lvdata: 536.9 GB, 536866717696 bytes, 1048567808 sectors Units = sectors of 1 * 512 = 512 bytes Sector size (logical/physical): 512 bytes / 512 bytes I/O size (minimum/optimal): 512 bytes / 512 bytes
集群分布:4台(1台tidb、3台tikv) 数据量:2.5亿行
我做了什么:使用flink批量向tidb写数据,10个并发、每个批次100条,运行了一段时间后:客户端报:Caused by: java.sql.SQLException: TiKV server timeout at com.mysql.jdbc.SQLError.createSQLException(SQLError.java:957) at com.mysql.jdbc.MysqlIO.checkErrorPacket(MysqlIO.java:3878) at com.mysql.jdbc.MysqlIO.checkErrorPacket(MysqlIO.java:3814) at com.mysql.jdbc.MysqlIO.sendCommand(MysqlIO.java:2478) at com.mysql.jdbc.MysqlIO.sqlQueryDirect(MysqlIO.java:2625) at com.mysql.jdbc.ConnectionImpl.execSQL(ConnectionImpl.java:2551) at com.mysql.jdbc.PreparedStatement.executeInternal(PreparedStatement.java:1861) at com.mysql.jdbc.PreparedStatement.executeUpdateInternal(PreparedStatement.java:2073) at com.mysql.jdbc.PreparedStatement.executeUpdateInternal(PreparedStatement.java:2009) at com.mysql.jdbc.PreparedStatement.executeLargeUpdate(PreparedStatement.java:5094) at com.mysql.jdbc.PreparedStatement.executeBatchedInserts(PreparedStatement.java:1543) … 8 more
服务器端(tidb)一直报: [2019/10/25 13:13:10.371 +08:00] [WARN] [backoff.go:313] [“tikvRPC backoffer.maxSleep 40000ms is exceeded, errors: send tikv request error: context deadline exceeded, ctx: region ID: 1280, meta: id:1280 start_key:“t\200\000\000\000\000\000\001\026_r\334\000\000\000\000\ \343\037” end_key:“t\200\000\000\000\000\000\001\026_r\342\000\000\000\000\005\376\222” region_epoch:<conf_ver:5 version:103 > peers:<id:1281 store_id:1 > peers:<id:1282 store_id:4 > peers:<id:1283 store_id:5 > , peer: id:1283 store_id:5 , addr: 10.0.66.76:20160, idx: 2, try next peer later at 2019-10-25T13:12:49.26110312+08:00 not leader: region_id:1280 leader:<id:1283 store_id:5 > , ctx: region ID: 1280, meta: id:1280 start_key:“t\200\000\000\000\000\000\001\026_r\334\000\000\000\000\ \343\037” end_key:“t\200\000\000\000\000\000\001\026_r\342\000\000\000\000\005\376\222” region_epoch:<conf_ver:5 version:103 > peers:<id:1281 store_id:1 > peers:<id:1282 store_id:4 > peers:<id:1283 store_id:5 > , peer: id:1281 store_id:1 , addr: 10.0.66.74:20160, idx: 0 at 2019-10-25T13:12:49.27209939+08:00 send tikv request error: context deadline exceeded, ctx: region ID: 1280, meta: id:1280 start_key:“t\200\000\000\000\000\000\001\026_r\334\000\000\000\000\ \343\037” end_key:“t\200\000\000\000\000\000\001\026_r\342\000\000\000\000\005\376\222” region_epoch:<conf_ver:5 version:103 > peers:<id:1281 store_id:1 > peers:<id:1282 store_id:4 > peers:<id:1283 store_id:5 > , peer: id:1283 store_id:5 , addr: 10.0.66.76:20160, idx: 2, try next peer later at 2019-10-25T13:13:10.371660992+08:00”] [2019/10/25 13:13:10.371 +08:00] [INFO] [2pc.go:888] [“2PC cleanup failed”] [conn=17392] [error="[tikv:9002]TiKV server timeout"] [errorVerbose="[tikv:9002]TiKV server timeout github.com/pingcap/errors.AddStack /home/jenkins/workspace/release_tidb_3.0/go/pkg/mod/github.com/pingcap/errors@v0.11.4/errors.go:174 github.com/pingcap/errors.Trace /home/jenkins/workspace/release_tidb_3.0/go/pkg/mod/github.com/pingcap/errors@v0.11.4/juju_adaptor.go:15 github.com/pingcap/tidb/store/tikv.(*RegionRequestSender).onSendFail /home/jenkins/workspace/release_tidb_3.0/go/src/github.com/pingcap/tidb/store/tikv/region_request.go:182 github.com/pingcap/tidb/store/tikv.(*RegionRequestSender).sendReqToRegion /home/jenkins/workspace/release_tidb_3.0/go/src/github.com/pingcap/tidb/store/tikv/region_request.go:148 github.com/pingcap/tidb/store/tikv.(*RegionRequestSender).SendReqCtx /home/jenkins/workspace/release_tidb_3.0/go/src/github.com/pingcap/tidb/store/tikv/region_request.go:116 github.com/pingcap/tidb/store/tikv.(*RegionRequestSender).SendReq /home/jenkins/workspace/release_tidb_3.0/go/src/github.com/pingcap/tidb/store/tikv/region_request.go:72 github.com/pingcap/tidb/store/tikv.(*tikvStore).SendReq /home/jenkins/workspace/release_tidb_3.0/go/src/github.com/pingcap/tidb/store/tikv/kv.go:367 github.com/pingcap/tidb/store/tikv.(*twoPhaseCommitter).cleanupSingleBatch /home/jenkins/workspace/release_tidb_3.0/go/src/github.com/pingcap/tidb/store/tikv/2pc.go:816 github.com/pingcap/tidb/store/tikv.(*twoPhaseCommitter).doActionOnBatches.func1 /home/jenkins/workspace/release_tidb_3.0/go/src/github.com/pingcap/tidb/store/tikv/2pc.go:423 runtime.goexit /usr/local/go/src/runtime/asm_amd64.s:1337"] [txnStartTS=412084902103613452]
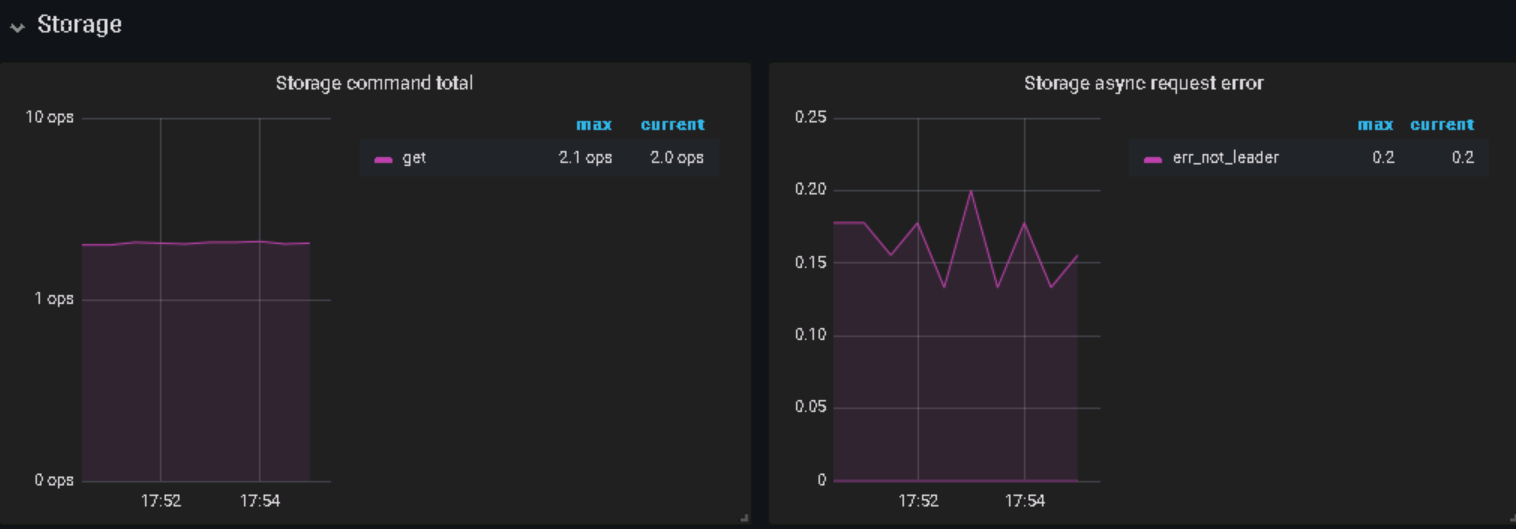
服务器端(tikv)一直报: [2019/10/25 13:13:45.967 +08:00] [ERROR] [process.rs:179] [“get snapshot failed”] [err=“Request(message: “peer is not leader” not_leader { region_id: 1280 leader { id: 1283 store_id: 5 } })”] [cid=870985] [2019/10/25 13:13:47.711 +08:00] [ERROR] [process.rs:179] [“get snapshot failed”] [err=“Request(message: “peer is not leader” not_leader { region_id: 1280 leader { id: 1283 store_id: 5 } })”] [cid=870986] [2019/10/25 13:13:49.994 +08:00] [ERROR] [process.rs:179] [“get snapshot failed”] [err=“Request(message: “peer is not leader” not_leader { region_id: 1280 leader { id: 1283 store_id: 5 } })”] [cid=870987] [2019/10/25 13:13:50.239 +08:00] [ERROR] [process.rs:179] [“get snapshot failed”] [err=“Request(message: “peer is not leader” not_leader { region_id: 1280 leader { id: 1283 store_id: 5 } })”] [cid=870988] [2019/10/25 13:13:57.981 +08:00] [ERROR] [process.rs:179] [“get snapshot failed”] [err=“Request(message: “peer is not leader” not_leader { region_id: 124 leader { id: 127 store_id: 5 } })”] [cid=870989] [2019/10/25 13:14:00.772 +08:00] [ERROR] [endpoint.rs:454] [error-response] [err=“region message: “peer is not leader” not_leader { region_id: 1220 leader { id: 1223 store_id: 5 } }”]
关键词:TiKV server timeout、peer is not leader