tidb binlog部署时prometheus 报错:
TASK [wait until the prometheus metrics page is available] ************************************************************************************
FAILED - RETRYING: wait until the prometheus metrics page is available (12 retries left).
FAILED - RETRYING: wait until the prometheus metrics page is available (11 retries left).
FAILED - RETRYING: wait until the prometheus metrics page is available (10 retries left).
FAILED - RETRYING: wait until the prometheus metrics page is available (9 retries left).
FAILED - RETRYING: wait until the prometheus metrics page is available (8 retries left).
FAILED - RETRYING: wait until the prometheus metrics page is available (7 retries left).
FAILED - RETRYING: wait until the prometheus metrics page is available (6 retries left).
FAILED - RETRYING: wait until the prometheus metrics page is available (5 retries left).
FAILED - RETRYING: wait until the prometheus metrics page is available (4 retries left).
FAILED - RETRYING: wait until the prometheus metrics page is available (3 retries left).
FAILED - RETRYING: wait until the prometheus metrics page is available (2 retries left).
FAILED - RETRYING: wait until the prometheus metrics page is available (1 retries left).
fatal: [192.168.10.201]: FAILED! => {"attempts": 12, "changed": false, "content": "", "msg": "Status code was -1 and not [200]: Request failed: <urlopen error [Errno 111] 拒绝连接>", "redirected": false, "status": -1, "url": "http://192.168.10.201:9090/metrics"}
	to retry, use: --limit @/home/tidb/tidb-ansible-2.1.15/retry_files/start.retry
日志:
level=info ts=2019-08-16T02:27:49.663943803Z caller=main.go:573 msg="Notifier manager stopped"
level=error ts=2019-08-16T02:27:49.66398789Z caller=main.go:582 err="Error loading config couldn't load configuration (--config.file=/data/deploy/conf/prometheus.yml): parsing YAML file /data/deploy/conf/prometheus.yml: yaml: line 94: did not find expected key"
level=info ts=2019-08-16T02:27:49.66402133Z caller=main.go:584 msg="See you next time!"
level=info ts=2019-08-16T02:28:04.852686666Z caller=main.go:220 msg="Starting Prometheus" version="(version=2.2.1, branch=HEAD, revision=bc6058c81272a8d938c05e75607371284236aadc)"
level=info ts=2019-08-16T02:28:04.852811198Z caller=main.go:221 build_context="(go=go1.10, user=root@149e5b3f0829, date=20180314-14:15:45)"
level=info ts=2019-08-16T02:28:04.852846659Z caller=main.go:222 host_details="(Linux 3.10.0-957.el7.x86_64 #1 SMP Thu Nov 8 23:39:32 UTC 2018 x86_64 tidb1 (none))"
level=info ts=2019-08-16T02:28:04.852876222Z caller=main.go:223 fd_limits="(soft=1000000, hard=1000000)"
level=info ts=2019-08-16T02:28:04.857138497Z caller=main.go:504 msg="Starting TSDB ..."
level=info ts=2019-08-16T02:28:04.857156821Z caller=web.go:382 component=web msg="Start listening for connections" address=:9090
level=info ts=2019-08-16T02:28:05.256558553Z caller=main.go:514 msg="TSDB started"
level=info ts=2019-08-16T02:28:05.25672965Z caller=main.go:588 msg="Loading configuration file" filename=/data/deploy/conf/prometheus.yml
level=info ts=2019-08-16T02:28:05.257106534Z caller=main.go:398 msg="Stopping scrape discovery manager..."
level=info ts=2019-08-16T02:28:05.257136781Z caller=main.go:411 msg="Stopping notify discovery manager..."
level=info ts=2019-08-16T02:28:05.257147691Z caller=main.go:432 msg="Stopping scrape manager..."
level=info ts=2019-08-16T02:28:05.257284342Z caller=manager.go:460 component="rule manager" msg="Stopping rule manager..."
level=info ts=2019-08-16T02:28:05.257320393Z caller=manager.go:466 component="rule manager" msg="Rule manager stopped"
level=info ts=2019-08-16T02:28:05.257335278Z caller=notifier.go:512 component=notifier msg="Stopping notification manager..."
level=info ts=2019-08-16T02:28:05.257356162Z caller=main.go:394 msg="Scrape discovery manager stopped"
level=info ts=2019-08-16T02:28:05.257375412Z caller=main.go:407 msg="Notify discovery manager stopped"
level=info ts=2019-08-16T02:28:05.257480789Z caller=main.go:426 msg="Scrape manager stopped"
level=info ts=2019-08-16T02:28:05.257545215Z caller=main.go:573 msg="Notifier manager stopped"
level=error ts=2019-08-16T02:28:05.257609209Z caller=main.go:582 err="Error loading config couldn't load configuration (--config.file=/data/deploy/conf/prometheus.yml): parsing YAML file /data/deploy/conf/prometheus.yml: yaml: line 94: did not find expected key"
level=info ts=2019-08-16T02:28:05.257666298Z caller=main.go:584 msg="See you next time!"
prometheus.yml
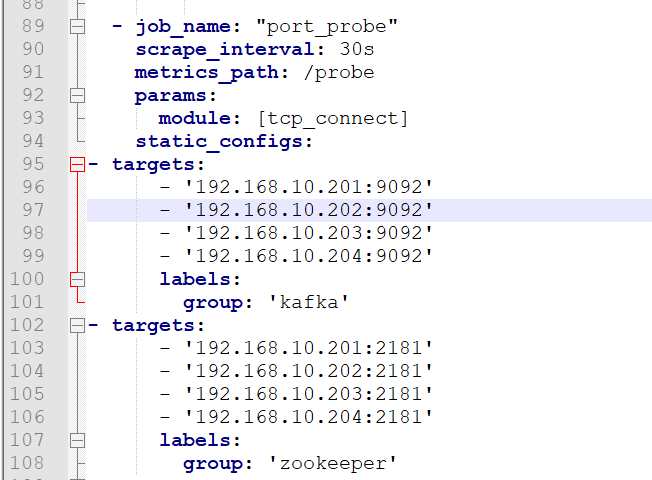
kafka和zookeeper正常,端口号也没问题