场景
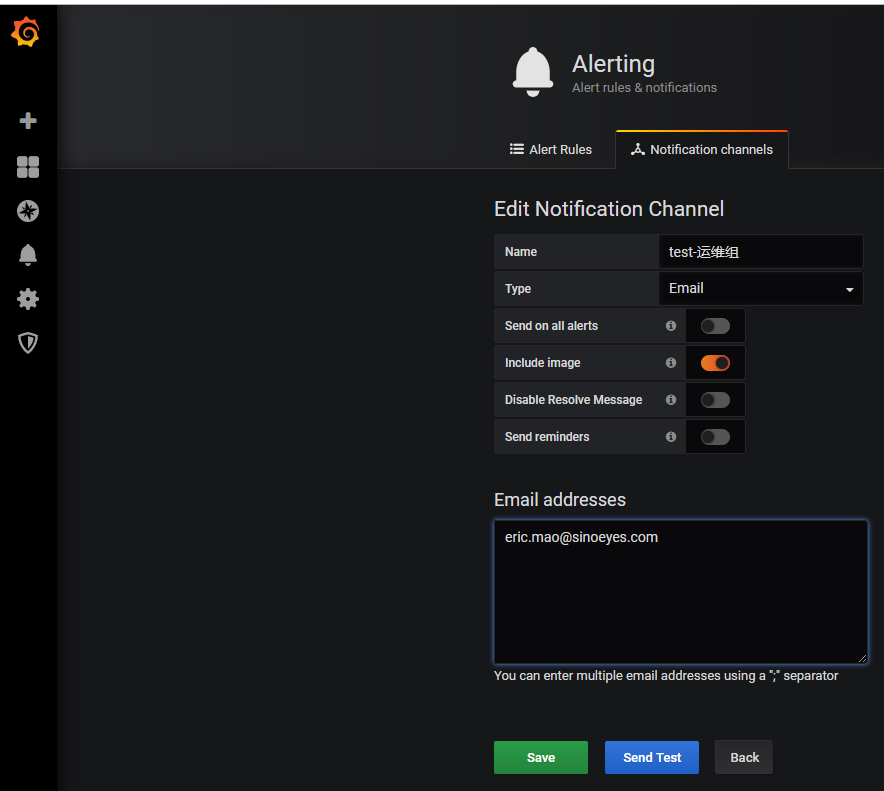
使用grafana 的 alerting 需要配置 SMTP
问题
我在tidb-ansible/目录下找不到 grafana.ini 的配置文件,来配置自己的 SMTP服务器
Grafana 所在机器的 opt/grafana/conf/grafana.ini 文件可以配置下。 然后执行下 ansible-planbook stop.yml --tag=grafana ansible-planbook start.yml --tag=grafana
[tidb@test1 conf]$ pwd
/home/tidb/tidb-ansible/conf
[tidb@test1 conf]$ vim grafana_collector.toml
......
# 配置邮件服务器
[smtp]
enabled = true
# 发件服务器
host = smtp.exmail.qq.com:465
# smtp 密码
password =
# smtp账号
user = testl@163.com
# 发信邮箱
from_address = testl@163.com
# 发信人
from_name = Grafana
[tidb@test1 tidb-ansible]$ ansible-playbook rolling_update_monitor.yml --tags=grafana
......
TASK [start grafana_collector by systemd] *******************************************************************************************************************************************************
changed: [172.160.180.46]

TASK [wait until the grafana_collector port is up] **********************************************************************************************************************************************
fatal: [172.160.180.46]: FAILED! => {"changed": false, "elapsed": 300, "msg": "the grafana_collector port 8686 is not up"}

NO MORE HOSTS LEFT ******************************************************************************************************************************************************************************
        to retry, use: --limit @/home/tidb/tidb-ansible/retry_files/rolling_update_monitor.retry

PLAY RECAP **************************************************************************************************************************************************************************************
172.160.180.46             : ok=46   changed=12   unreachable=0    failed=1
172.160.180.47             : ok=3    changed=0    unreachable=0    failed=0
172.160.180.48             : ok=3    changed=0    unreachable=0    failed=0
drainer_mysql_1            : ok=3    changed=0    unreachable=0    failed=0
drainer_mysql_2            : ok=3    changed=0    unreachable=0    failed=0
drainer_mysql_3            : ok=3    changed=0    unreachable=0    failed=0
localhost                  : ok=7    changed=4    unreachable=0    failed=0


ERROR MESSAGE SUMMARY ***************************************************************************************************************************************************************************
[172.160.180.46]: Ansible FAILED! => playbook: rolling_update_monitor.yml; TASK: wait until the grafana_collector port is up; message: {"changed": false, "elapsed": 300, "msg": "the grafana_collector port 8686 is not up"}

Ask for help:
Contact us: support@pingcap.com
It seems that you encounter some problems. You can send an email to the above email address, attached with the tidb-ansible/inventory.ini and tidb-ansible/log/ansible.log files and the error message, or new issue on https://github.com/pingcap/tidb-ansible/issues. We'll try our best to help you deploy a TiDB cluster. Thanks. :-)
[tidb@test1 tidb-ansible]$
修改了配置文件。检查下在部署目录下的 log/grafana_collector.log日志中有没有报错。
[tidb@test1 deploy]$ tail -1000f log/grafana_collector.log
2019/08/21 13:47:49 main.go:114: [info] got signal [15] to exit.
2019/08/21 13:48:35 main.go:95: [info] grafana_collector is serving at ':8686' and using grafana at 'http://172.160.180.46:3000'
2019/08/21 13:59:24 main.go:114: [info] got signal [15] to exit.
2019/08/21 14:00:10 main.go:95: [info] grafana_collector is serving at ':8686' and using grafana at 'http://172.160.180.46:3000'
2019/08/21 14:09:58 main.go:114: [info] got signal [15] to exit.
2019/08/21 14:10:43 main.go:95: [info] grafana_collector is serving at ':8686' and using grafana at 'http://172.160.180.46:3000'
2019/08/21 14:14:58 main.go:114: [info] got signal [15] to exit.
2019/08/21 14:15:43 main.go:95: [info] grafana_collector is serving at ':8686' and using grafana at 'http://172.160.180.46:3000'
2019/08/21 14:22:51 main.go:114: [info] got signal [15] to exit.
[tidb@test1 templates]$ pwd
/home/tidb/tidb-ansible/roles/grafana/templates
[tidb@test1 templates]$
[tidb@test1 templates]$ vim grafana.ini.j2
......
#################################### SMTP / Emailing ##########################
[smtp]
enabled = true
# 发件服务器
host = smtp.exmail.qq.com:465
# smtp 密码
password = 你的SMTP密码
# smtp账号
user = test@163.com
# 发信邮箱
from_address = test@163.com
# 发信人
from_name = Grafana

;enabled = false
;host = localhost:25
;user =
;password =
;cert_file =
;key_file =
;skip_verify = false
;from_address = admin@grafana.localhost

[emails]
;welcome_email_on_sign_up = false
......
[tidb@test1 tidb-ansible]$ ansible-playbook rolling_update_monitor.yml --tags=grafana
......
Congrats! All goes well. :-)
[tidb@test1 tidb-ansible]$
[tidb@test1 ~]$ vim /home/tidb/deploy/opt/grafana/conf/grafana.ini
此话题已在最后回复的 1 分钟后被自动关闭。不再允许新回复。